

Introduction
Price tells you where the market has been, but volume tells you who showed up to push it there. That single idea sits at the heart of every reliable forex volume trading strategy, and yet most retail traders ignore it completely. They chase candles, draw trendlines, and wonder why their breakouts keep failing. The truth is simpler than it sounds: a move backed by strong participation tends to hold, while a move on thin activity often collapses. In this guide, you will learn how to read volume the right way, why tick volume works in the decentralized forex market, and how to combine it with price action for cleaner entries and exits. We will cover practical setups, common mistakes, the tools that matter, and what serious research actually says about volume. By the end, you will see the chart differently.
Why Volume Matters in a Decentralized Market
Forex confuses newcomers because it has no central exchange. Stocks trade on the NYSE or Nasdaq, so every share that changes hands is recorded in one place. Currencies trade across a sprawling network of banks, brokers, and liquidity providers, which means no single source captures true global volume. This leads many traders to assume volume analysis is impossible in forex. That assumption costs them.
What your platform actually shows is tick volume, which counts the number of price changes within a given period rather than the number of contracts traded. A bar that ticks 800 times saw far more activity than one that ticked 90 times. Decades of comparison between tick volume and actual futures volume on currency contracts show a very high correlation, often above 90 percent. In practice, that means tick volume is a reliable proxy. When activity surges, more participants are engaged, and the resulting move carries more weight.
This is the foundation that makes a forex volume trading strategy viable. You are not measuring exact contract size. You are measuring conviction. And conviction is what separates a breakout that runs from a fakeout that traps. Once you accept tick volume as a legitimate signal, the entire market starts to read more clearly.
How to Use Volume in Forex Trading: The Core Principles
Learning how to use volume in forex trading starts with a single relationship: price and volume should agree. When price rises and volume rises with it, buyers are committed and the trend has fuel. When price rises but volume fades, the move is running on fumes and a stall or reversal becomes more likely. This simple agreement-or-divergence check is the engine behind most volume work.
The second principle is context. A high-volume bar means nothing in isolation. You must compare it to recent activity. A spike that dwarfs the last twenty bars signals something important happened, while volume that merely matches the average tells you little. This is why relative volume matters more than raw numbers. Traders often add a moving average to the volume histogram so they can instantly see whether the current bar is above or below normal participation.
The third principle is location. Volume carries the most meaning at decision points, such as support, resistance, trendlines, and round numbers. A volume surge as price tests a major level tells a story. Either buyers are defending the zone aggressively, or sellers are overwhelming it. When you combine agreement, context, and location, volume stops being noise and becomes a genuine edge. These three lenses turn a flat histogram into a map of market intent.
Volume Spread Analysis Forex: Reading Effort vs Result
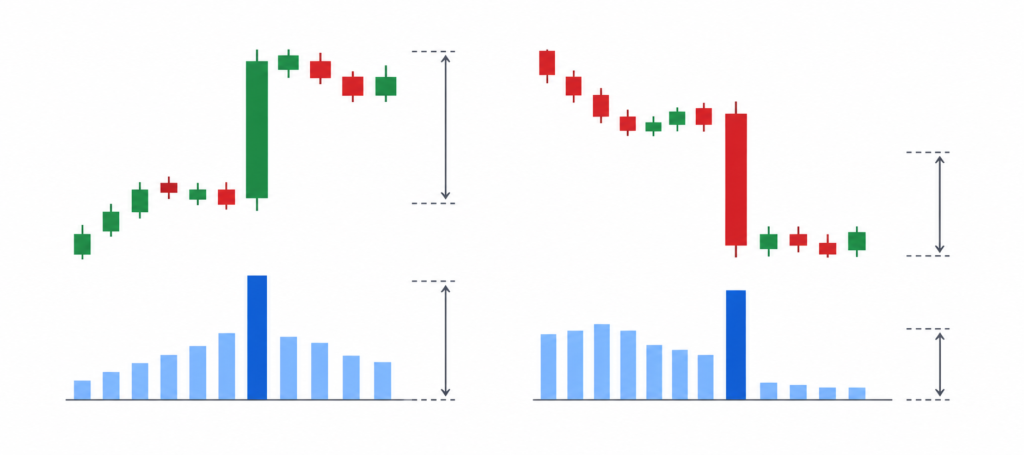
Volume spread analysis forex, often shortened to VSA, builds on the work of Richard Wyckoff and was popularized for modern traders by Tom Williams. Its central idea is the relationship between effort and result. The “spread” is the range of the candle from high to low, and the volume is the effort behind it. When effort and result match, the move is healthy. When they diverge, smart money is often doing the opposite of what the crowd expects.
Picture a wide-range down candle on enormous volume that closes near its high. Huge effort went into pushing price down, yet the result was a recovery into the close. That mismatch suggests buyers absorbed the selling, a classic sign of accumulation. Now picture a narrow candle on massive volume at the top of an uptrend. Heavy effort produced almost no upward progress, which hints that supply is entering and the rally may be exhausting.
VSA also names recognizable conditions. A “no demand” bar shows a small up candle on low volume, warning that buyers have lost interest. A “stopping volume” event shows a sharp spike that halts a decline, often marking a bottom. The skill lies in reading these footprints in real time rather than after the fact. VSA does not give mechanical buy and sell buttons. It gives you a way to interpret who is winning the battle inside each candle, and that interpretation sharpens every other decision you make.
A Practical Forex Volume Trading Strategy Step by Step
Here is a clean, repeatable approach you can test. Start by adding tick volume with a 20-period moving average to your chart, and keep your timeframe consistent, such as the 1-hour for swing setups or the 5-minute for intraday.
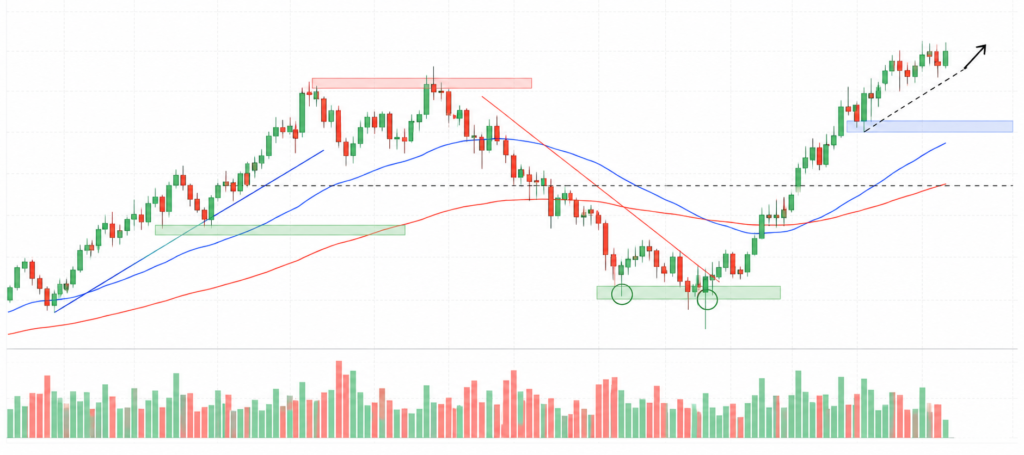
First, identify the trend and a key level, like a horizontal resistance that price has tested twice. Wait for price to approach that level. As the breakout candle forms, check the volume. If the breakout bar prints volume well above its 20-period average, that surge confirms genuine participation behind the move. A breakout on below-average volume is a warning sign and should usually be skipped or treated with caution.
Second, refine your entry. Rather than chasing the breakout candle, many traders wait for a low-volume pullback to the broken level. Low volume on the retest means few sellers are interested in pushing price back down, which often precedes continuation. Enter as price resumes in the breakout direction, placing your stop beyond the retest swing.
Third, manage the position with volume in mind. If the trend continues on healthy, rising or steady volume, hold. If you see a sudden climax spike followed by a sharp reversal candle, that exhaustion signal is your cue to tighten stops or take profit. This combination of breakout confirmation, low-volume retest entry, and climax-based exit forms a complete framework that respects what participation is telling you at every stage. Remember that this content is educational, not financial advice; always backtest and risk only what you can afford to lose.
Best Volume Indicators and How They Compare
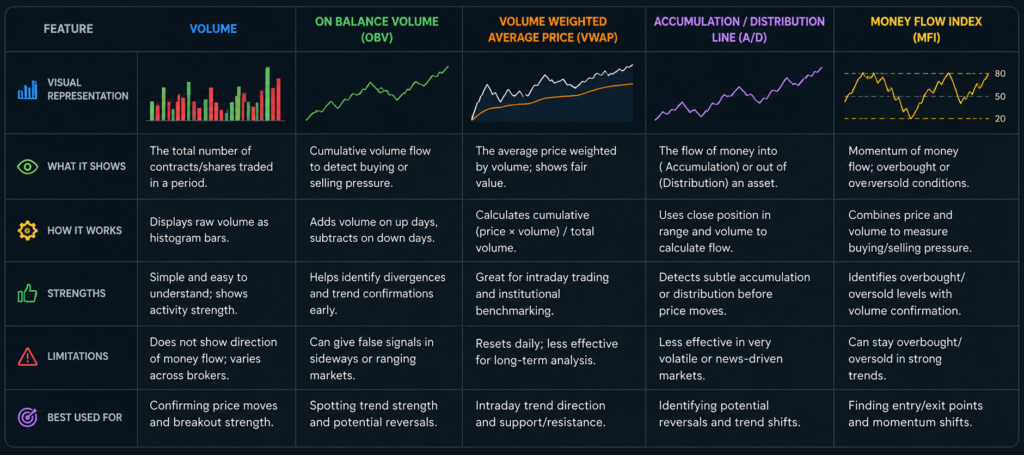
You do not need a dozen tools. You need a few you understand deeply. The raw volume histogram is your starting point because it shows participation directly. From there, several indicators distill volume into actionable signals, each with strengths and trade-offs.
On Balance Volume, or OBV, adds volume on up bars and subtracts it on down bars to create a running total. It excels at revealing divergence, where price makes a new high but OBV does not, hinting that the move lacks support. The Money Flow Index blends price and volume into an oscillator that flags overbought and oversold conditions with a volume weighting. Chaikin Money Flow measures buying and selling pressure over a set period, while VWAP gives intraday traders a fair-value benchmark that institutions watch closely.
The table below summarizes how the main tools stack up so you can choose what fits your style.
| Indicator | What It Measures | Best For | Main Limitation |
|---|---|---|---|
| Volume Histogram | Raw participation per bar | Confirming breakouts | No directional bias alone |
| On Balance Volume (OBV) | Cumulative volume flow | Spotting divergence | Slow to react in chop |
| Money Flow Index (MFI) | Volume-weighted momentum | Overbought/oversold zones | False signals in strong trends |
| Chaikin Money Flow (CMF) | Buying vs selling pressure | Trend confirmation | Sensitive to period setting |
| VWAP | Volume-weighted fair price | Intraday entries and exits | Resets each session |
Pick one confirmation tool and one momentum tool, then master them. Stacking five indicators that all use volume simply gives you the same signal dressed in different colors, which creates false confidence rather than real edge.
Common Volume Mistakes That Drain Accounts
The most frequent error is treating any high volume as bullish. Volume has no direction of its own. A massive spike can mark aggressive buying or panic selling, so you must read it alongside the candle’s close and location. Traders who buy every volume spike eventually catch a falling knife.
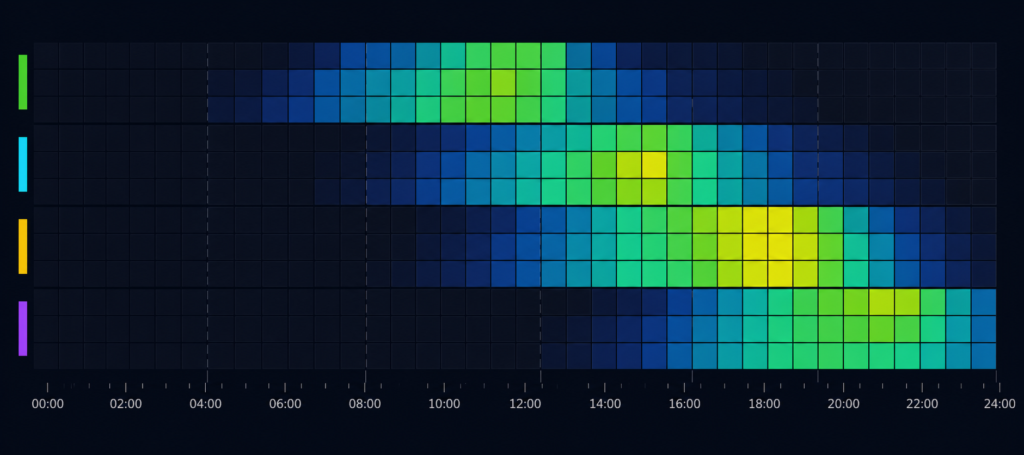
A second mistake is ignoring session overlap. Forex volume is not constant across the day. The London and New York overlap produces the heaviest activity, while the Asian session for many pairs runs thin. A breakout during a quiet period often lacks the participation to sustain itself, then unwinds when liquidity returns. Knowing when real volume arrives keeps you from trading ghosts.
The third mistake is abandoning confirmation when emotions run hot. After a few winning trades, traders start entering on price alone, skipping the volume check that gave them their edge in the first place. Discipline is the strategy. The fourth is over-optimizing volume thresholds during backtesting until the rules fit the past perfectly but fail in live markets. Keep your rules simple, robust, and tied to relative volume rather than fixed numbers, and your results will travel far better from the testing window into real conditions.
What Top Traders and Research Say
Serious study of volume is well documented. Anna Coulling’s A Complete Guide to Volume Price Analysis is one of the most accessible modern treatments, explaining how to read the story behind each bar using the effort-versus-result logic that underpins VSA. It is a practical starting point for anyone moving beyond pure price action into participation-based reading.
On the academic side, the influential study by Andrew Lo, Harry Mamaysky, and Jiang Wang, “Foundations of Technical Analysis,” published in the Journal of Finance in 2000, used rigorous statistical methods to show that certain technical patterns carry genuine, measurable information rather than being pure superstition. While the paper focuses on patterns broadly, its core finding gives credibility to the idea that systematic chart reading, including volume context, can add value when applied with discipline.
The legendary trader Jesse Livermore captured the mindset that volume traders share. “The big money is not in the buying and selling, but in the waiting.” Volume teaches exactly that patience, because the best signals appear only when participation confirms intent. Read widely, test rigorously, and let confirmed conviction, not impulse, decide your entries.
Frequently Asked Questions
Does volume really work in forex if there is no central exchange?
Yes, because platforms display tick volume, which counts price changes rather than contracts. Studies comparing tick volume to actual currency futures volume show correlation above 90 percent, so it serves as a reliable proxy. A practical forex volume trading strategy relies on this proxy to gauge participation. You are measuring conviction and engagement, not exact contract size, and that is enough to confirm or question a move.
What is the simplest way to start using volume?
Add a volume histogram with a 20-period moving average and watch whether breakout bars exceed average activity. That single habit teaches you how to use volume in forex trading without complex tools. Above-average volume on a breakout confirms participation, while below-average volume warns of a possible fakeout. Master that relationship first, then layer in OBV or VWAP once you are comfortable.
What is volume spread analysis forex and is it hard to learn?
Volume spread analysis forex reads the relationship between a candle’s range, its close, and the volume behind it to reveal whether smart money is accumulating or distributing. It is not difficult conceptually, but it rewards practice. Start with two patterns, no demand and stopping volume, and study them across many charts. Over time, reading effort versus result becomes second nature.
Which volume indicator is best for beginners?
On Balance Volume is an excellent first choice because it clearly reveals divergence between price and participation. For intraday traders, VWAP offers a respected fair-value benchmark. Avoid stacking many indicators at once, since several volume tools often repeat the same signal. Choose one confirmation tool, learn it deeply, and add complexity only when your results justify it.
Can I use a volume strategy for scalping?
Yes. Relative volume and VWAP work well for fast intraday and scalping setups, especially during the London and New York overlap when participation peaks. Trade volume surges at key intraday levels and avoid thin Asian-session moves for most major pairs. Tighter timeframes demand stricter discipline, so keep your confirmation rules consistent and your stops well defined.
How do I avoid false signals when trading volume?
Always read volume alongside the candle’s close and its location at a key level, never in isolation. Respect session timing, since quiet periods produce unreliable spikes. Use relative volume rather than fixed thresholds so your rules adapt across pairs. Combining agreement, context, and location filters out most noise and keeps your forex volume trading strategy grounded in genuine market intent.
Final Thoughts
Volume is the missing layer for traders who feel stuck reading price alone. Once you understand that tick volume reliably measures participation, the forex chart transforms from a guessing game into a story of intent. A strong forex volume trading strategy rests on three simple lenses: price and volume should agree, context comes from relative activity, and the loudest signals appear at key levels. Learn how to use volume in forex trading through breakout confirmation and low-volume retests, deepen your reading with volume spread analysis forex, and confirm everything with one or two well-chosen indicators. Avoid the common traps of treating spikes as directional, ignoring session timing, and over-optimizing your rules. Trade with patience, backtest honestly, and let confirmed conviction lead. This article is educational, not financial advice. For more practical forex guides, strategies, and market insights, explore the latest articles at forextradingboards.com and sharpen your edge today.