

Introduction
Most losing traders stare at a five-minute chart and wonder why the market keeps reversing on them. The answer is usually simple: they are trading blind to the bigger picture. Top down analysis forex trading fixes that problem by forcing you to read the market from the largest timeframe down to the smallest before you ever place an order. You start by understanding the dominant trend on the monthly and weekly charts, then narrow your focus to the daily and four-hour, and finally zoom into a lower timeframe for a precise entry. This article walks you through exactly how the method works, why professionals rely on it, and how to apply it without overcomplicating your routine. You will learn how to build a clear higher timeframe bias forex trading plan, avoid common mistakes, and turn scattered observations into one structured decision. By the end, you will see charts the way institutional desks do.

What Top Down Analysis Actually Means
Top down analysis is a way of reading the forex market that moves from the broadest view to the narrowest. Instead of guessing direction on a single chart, you build your decision in layers. The higher timeframes tell you where the market is going. The lower timeframes tell you when to act. When both agree, you have a high-probability setup. When they disagree, you wait.
Think of it like planning a road trip. You first look at the full map of the country to choose your destination. Then you study the regional roads to pick your route. Only at the end do you check the street-level view to find the exact turn. Skipping the big map and starting at street level is how traders get lost. The same logic applies to charts. The monthly view is your country map, and the fifteen-minute chart is your street view.
This method matters because forex markets trend across multiple timeframes at once, and those trends often conflict. A pair can rise on the daily while falling on the hourly. Without a structured approach, you react to whatever timeframe you happen to be watching. With top down analysis forex trading, you anchor every decision to the dominant trend and stop fighting the market.
Why Higher Timeframe Bias Comes First
Every solid trade begins with a directional view, and that view comes from the largest charts. Higher timeframe bias forex trading simply means deciding whether you are looking for buys or sells before you study any entry. This single rule filters out a huge share of bad trades because it stops you from buying into a clear downtrend or shorting a strong rally.
The higher timeframes carry more weight for a practical reason. A candle on the weekly chart represents an entire week of orders from banks, funds, and retail traders combined. That much participation creates levels and trends that are far more reliable than the noise on a one-minute chart. When price respects a weekly support zone, it does so because serious capital is positioned there. Lower timeframe moves, by contrast, are easily reversed by a single news headline or a burst of stop-hunting.
So the goal early in your analysis is narrow: decide the bias. Is the larger structure bullish, bearish, or ranging? You are not looking for an entry yet. You are only establishing the direction you will respect for the rest of your session. Once that bias is set, everything you do on the lower charts must align with it. This discipline is the backbone of consistent trading, and it separates planned execution from emotional reaction.
The Standard Timeframe Hierarchy
Most traders use three timeframes, sometimes four. The first sets the bias, the second confirms structure and locates key zones, and the third times the entry. The exact charts you choose depend on your style. A swing trader might use the weekly, daily, and four-hour. A day trader might use the daily, four-hour, and fifteen-minute. The principle stays the same regardless of the combination: each step zooms in by a meaningful factor.
The table below shows how each timeframe typically contributes to a complete top down read. Use it as a reference when building your own routine rather than as a rigid rule.
| Timeframe | Primary Role | What You Look For | Best Suited For |
|---|---|---|---|
| Monthly | Macro context | Long-term trend, major levels | Position traders |
| Weekly | Dominant bias | Trend direction, key swing points | Swing and position |
| Daily | Structure and bias | Higher highs and lows, demand zones | Swing and day traders |
| H4 | Setup zone | Pullbacks, level reactions | Swing and day traders |
| H1 | Refinement | Confirmation of intent | Day traders |
| M15 | Entry timing | Trigger patterns, precise entry | Day and scalp traders |
A common mistake is using timeframes that sit too close together, such as the fifteen-minute and the five-minute. They show almost the same information, so you gain no new perspective. Keep a clear gap between each layer. A useful rule of thumb is to step down by a factor of roughly four to six, which is why the daily, four-hour, and fifteen-minute combination works so well for active traders.
How to Do Top Down Analysis in Practice
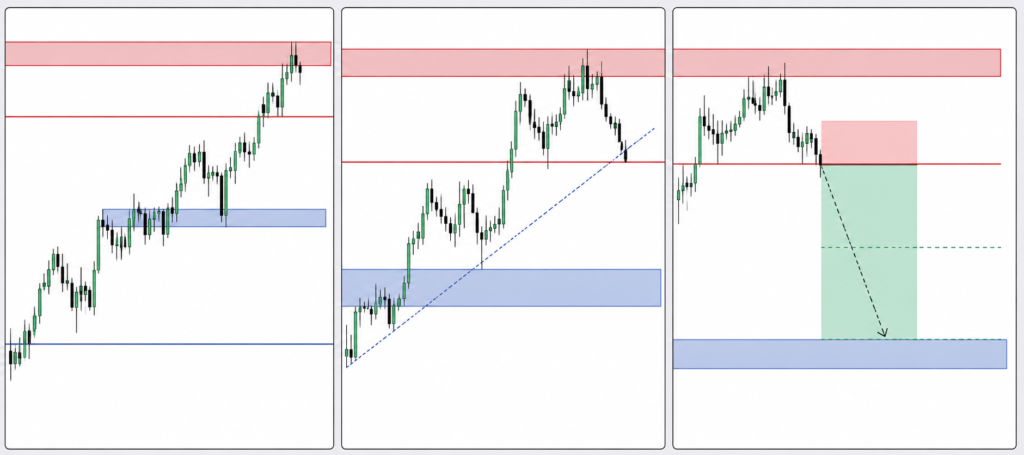
The real skill is turning theory into a repeatable routine, so here is how to do top down analysis forex step by step. Start with your highest chart, usually the weekly or daily depending on your style. Identify the trend using simple market structure. Is price making higher highs and higher lows, or lower highs and lower lows? Mark the obvious swing points and the major support and resistance zones. Write down a single sentence describing your bias, such as “bullish above the weekly demand zone.” That sentence governs everything that follows.
Next, drop to your middle timeframe, typically the four-hour. Here you refine your view and hunt for the area where you want to engage. If your bias is bullish, you are watching for price to pull back into a support zone or a clean level where buyers are likely to step in. You are not entering yet. You are confirming that the structure on this chart agrees with the larger trend and locating the zone that offers the best risk and reward. If the four-hour structure contradicts your higher bias, you note the conflict and prepare to wait.
Finally, move to your lowest timeframe to time the entry. This is where you look for a trigger: a bullish engulfing candle at support, a break of a small descending trendline, or a clear shift in short-term structure. Because your bias and zone are already defined, the entry decision becomes fast and unemotional. You place your stop beyond the level that would invalidate your idea and set a target at the next significant higher timeframe zone. The whole process flows in one direction, from macro to micro, and each layer earns the right to the next.
This content is educational and not financial advice. Always test any method on a demo account and manage risk before trading real capital.
Resolving Conflicts Between Timeframes
Timeframes will not always agree, and learning to handle disagreement is what makes the method powerful. The default rule is straightforward: the higher timeframe wins. If the daily is bullish but the four-hour is pulling back, that pullback is an opportunity to join the larger trend, not a reason to short against it. Counter-trend trades against a strong higher timeframe move are among the most expensive mistakes a trader can make.
There are sensible exceptions. When the highest timeframe is clearly ranging rather than trending, the bias becomes neutral, and you can trade both directions between the boundaries of that range. In this case the middle timeframe carries more influence because there is no dominant trend to override it. The key is to recognize the difference between a trend and a range before you decide which chart leads. Trading a range as if it were a trend, or a trend as if it were a range, produces a steady stream of losses.
When signals conflict and you cannot form a clear view, the correct action is simply to do nothing. No trade is itself a position. The market produces thousands of setups every month, and you only need a handful of clean ones. Patience born from a structured top down read will always outperform forced entries built on hope.
Top Down Analysis for Different Trading Styles
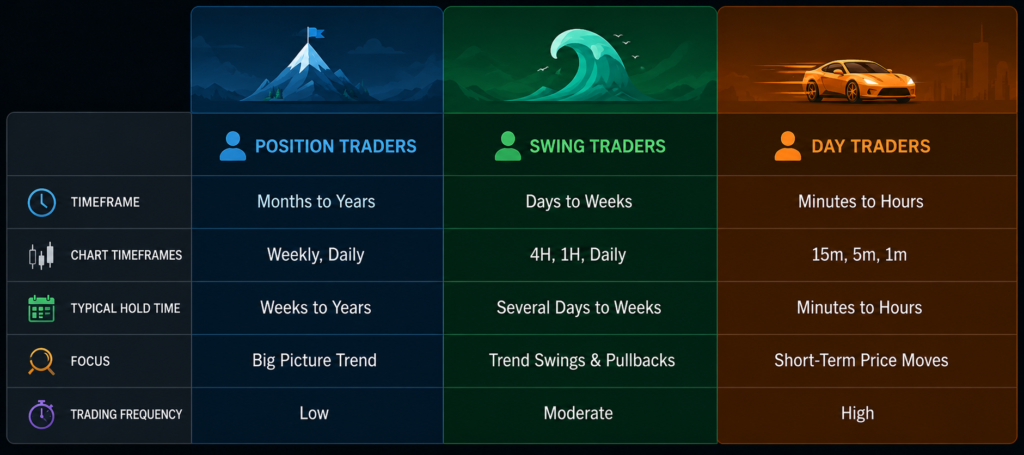
The beauty of this approach is that it scales to any time horizon. A position trader holding for weeks anchors to the monthly chart, confirms on the weekly, and enters on the daily. They care little about intraday noise and let trends develop over long stretches. Their stops are wide and their targets are ambitious, but the underlying logic is identical to everyone else’s.
A swing trader compresses the same structure into the weekly, daily, and four-hour. They aim to capture multi-day moves and typically hold positions through several sessions. For this group, the daily chart usually carries the bias while the four-hour locates the entry zone and the lower timeframe sharpens execution. This combination offers a healthy balance between clear signals and reasonable trade frequency, which is why so many full-time traders gravitate toward it.
A day trader shifts everything down a level, often using the daily for context, the four-hour or one-hour for the setup, and the fifteen-minute or five-minute for the trigger. Because intraday charts move fast, discipline matters even more here. The higher timeframe bias acts as an anchor that stops a day trader from getting whipsawed by every minor swing. Whatever your style, the framework remains a constant, and only the specific charts change.
Common Mistakes That Ruin a Good Read
The first and most damaging mistake is starting from the bottom up. Many traders open a low timeframe, spot an exciting pattern, and only afterward check the bigger picture to justify the trade they already want. This is analysis in reverse, and it leads straight to fighting the dominant trend. Always begin at the top and let the larger charts decide your direction before the small ones tempt you.
Another frequent error is overloading the screen with too many timeframes and indicators. Three charts done well beat six charts done poorly. When every timeframe shouts a different signal, paralysis follows, and the trader either freezes or jumps at random. Keep your hierarchy lean and your levels clean. The goal of top down analysis forex trading is clarity, not complexity.
Traders also fall into the trap of forcing alignment that is not really there. If the higher timeframe is bullish but the entry chart refuses to confirm, the honest answer is to wait, not to invent a reason to enter. Finally, many people skip writing down their bias, which lets emotion rewrite the plan mid-trade. A single recorded sentence about your directional view keeps you accountable when the market starts to tempt you off course.
What Top Traders and Research Say
The most respected names in technical trading have argued for this layered approach for decades. In Technical Analysis of the Financial Markets, John J. Murphy stresses that analysis should always move from the long-term picture to the short-term, because a signal on a daily chart carries far more weight when it agrees with the weekly and monthly trends. His work remains a standard reference for traders building a structured method.
Alexander Elder formalized the idea most directly in Trading for a Living with his “Triple Screen” trading system. Elder advocates examining three timeframes in sequence, using the longest to establish the tide of the market, the intermediate to spot the wave against that tide, and the shortest to time the entry. This is essentially top down analysis with a memorable name, and it has influenced a generation of traders.
Academic research supports the value of structured technical reading as well. In their 2000 study “Foundations of Technical Analysis,” Andrew Lo, Harry Mamaysky, and Jiang Wang found that several technical patterns carried genuine, measurable information for prices, lending statistical credibility to disciplined chart analysis. As Jesse Livermore famously put it, “The trend is your friend.” That single line captures the spirit of trading in alignment with the higher timeframe rather than against it.
Frequently Asked Questions
What is top down analysis in forex trading?
Top down analysis forex trading is a method of reading the market from the highest timeframe to the lowest. You set your directional bias on large charts like the weekly and daily, confirm structure on a middle timeframe, and time entries on a smaller one. This keeps every trade aligned with the dominant trend and filters out low-quality setups that fight the bigger picture.
How do I do top down analysis step by step?
To learn how to do top down analysis forex, start with your highest chart and define the trend using market structure. Then drop to a middle timeframe to locate key support or resistance zones that match your bias. Finally, move to a lower timeframe for a precise entry trigger. Each step narrows your focus while staying anchored to the higher timeframe direction.
Why does higher timeframe bias matter so much?
Higher timeframe bias forex trading matters because larger charts reflect far more market participation and produce more reliable trends and levels. A weekly candle captures a full week of institutional and retail orders, so its signals override short-term noise. Trading in the direction of that bias dramatically improves your odds and stops you from entering against strong, well-funded moves.
Which timeframes should I use for top down analysis?
The best combination depends on your style. Swing traders often use the weekly, daily, and four-hour, while day traders favor the daily, four-hour, and fifteen-minute. Keep a clear gap between each layer, stepping down by roughly four to six times, so each chart adds new information instead of repeating what you already see.
What do I do when timeframes disagree?
When timeframes conflict, the higher timeframe normally wins, so a pullback against a strong daily trend becomes an entry opportunity rather than a reversal trade. If the highest chart is ranging, treat the bias as neutral and trade between the range boundaries. When you cannot form a clear view, stay out, because no trade is a valid and often profitable decision.
Is top down analysis good for beginners?
Yes, it is one of the best frameworks for newer traders because it imposes structure and discipline. By forcing you to define a bias before entering, it prevents many impulsive mistakes. Start with three timeframes, keep your charts clean, and practice on a demo account. Remember that this is educational guidance, not financial advice, so always manage your risk.
Final Thoughts
Top down analysis turns chaotic charts into a clear, ordered decision. Instead of reacting to whatever timeframe happens to be in front of you, you build your trade in deliberate layers, letting the largest charts set direction and the smallest charts pinpoint timing. That structure is exactly why professional desks and the most respected trading authors have relied on multi-timeframe reading for decades. When you commit to setting your higher timeframe bias forex trading view first and only then hunting for entries, you stop fighting the market and start trading with it. The method is simple, but its discipline is powerful, and consistency comes from repeating that routine until it becomes second nature. Master top down analysis forex trading and you will gain the kind of clarity that separates planned execution from gambling. For more practical strategies, chart breakdowns, and trading guides, keep reading and growing your edge at forextradingboards.com.