
Introduction
Most traders chase momentum, but few understand how to measure it with precision. That is where CCI indicator forex trading earns its place on your chart. The Commodity Channel Index reads how far price has strayed from its average, helping you spot overbought zones, oversold dips, and powerful trend reversals before the crowd reacts. In this guide, you will learn what CCI is, who built it, and why it works across major and minor currency pairs. We will break down the best cci indicator settings for forex, walk through clear entry and exit rules, and show how divergence signals can warn you early. You will also see how top traders and academic research view momentum tools like this one. By the end, you will trade the CCI with confidence and a real plan, not guesswork.
What Is the CCI Indicator?
The Commodity Channel Index is a momentum oscillator that measures how far the current price sits from its statistical average over a chosen period. Despite the word “commodity” in its name, traders use it across every market, and commodity channel index forex trading has become especially popular on currency pairs. The tool was created by Donald Lambert in 1980, originally to spot cyclical turns in commodities. Lambert designed it to fluctuate around a zero line, with most readings staying inside a band between +100 and -100.
The math behind it is simpler than it looks. CCI takes the typical price of each candle, which is the average of the high, low, and close, and compares it to a moving average of that typical price. It then divides the difference by a multiple of the mean deviation. The result is a single line that swings above and below zero. When price runs far above its average, the line climbs sharply. When price drops well below average, the line falls just as fast.
This design makes the CCI a sensitive read on momentum and stretch. It tells you not just the direction of price, but how forcefully it is moving relative to recent behavior. For forex traders, that sensitivity is valuable. Currency pairs trend, range, and reverse in cycles, and a tool that flags when a move has gone too far gives you an early edge. That is why so many traders keep this oscillator on their charts alongside price action.
How CCI Works in the Forex Market
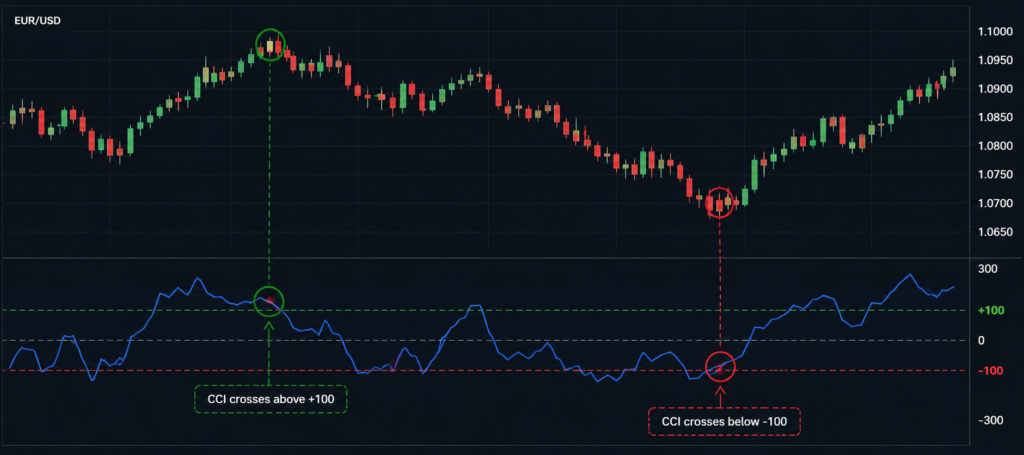
The CCI shines because it adapts to the rhythm of currency pairs. Forex moves in waves driven by interest rate expectations, economic data, and shifting sentiment. The CCI captures the strength of those waves. When a pair like EUR/USD pushes the line above +100, momentum is strong and buyers are firmly in control. When the line drops below -100, sellers are dominating. These thresholds are the heart of how the indicator communicates with you.
There are two main ways traders read the oscillator, and both matter. The first treats extreme readings as overbought and oversold warnings. A reading well above +100 can signal that a rally is stretched and may pause or reverse. A reading deep below -100 can flag an oversold dip ripe for a bounce. The second approach treats the same extremes as proof of trend strength. In a strong uptrend, the line can stay above +100 for a long stretch, and that persistence confirms the move rather than warning against it.
This dual nature is exactly why context matters so much. The same signal means different things in a trending market versus a ranging one. A skilled trader reads the broader chart first, then lets the CCI fine-tune the timing. Pair the oscillator with support and resistance, trendlines, or a higher timeframe view, and its signals become far more reliable. Used alone, it can mislead. Used with structure, it sharpens your decisions.
Best CCI Indicator Settings for Forex
The right configuration depends on how you trade. The most common starting point is the 14-period CCI, which Lambert’s followers and modern platforms often use as a default. Some traders prefer the 20-period version because it smooths the line and reduces noise, which suits longer holding times. Faster traders shrink the period to react sooner, while patient swing traders lengthen it to filter out small wiggles. The key is matching the cci indicator settings for forex to your timeframe and tolerance for signals.
A shorter period reacts quickly but produces more false alerts. A longer period reacts slowly but gives cleaner, more trustworthy signals. Scalpers on a one or five minute chart often want speed, so a tighter setting works. Day traders on the fifteen minute or one hour chart usually balance speed and reliability around the standard period. Swing traders on the four hour and daily charts lean toward the 20-period for stability. There is no single perfect number, only the number that fits your style after honest testing.
The table below outlines practical starting points by trading style. Treat these as a foundation, then refine them through backtesting on the pairs you actually trade.
| Trading Style | Typical Timeframe | Suggested CCI Period | Key Levels | Primary Use |
|---|---|---|---|---|
| Scalping | 1m – 5m | 7 – 10 | +100 / -100 | Fast momentum entries |
| Day Trading | 15m – 1H | 14 | +100 / -100 | Trend timing and pullbacks |
| Swing Trading | 4H – Daily | 20 | +100 / -100 | Trend confirmation, divergence |
| Position Trading | Daily – Weekly | 20 – 30 | +100 / -100 | Long-term cycle reading |
Beyond the period, you can adjust the overbought and oversold levels. Many traders widen them to +200 and -200 on volatile pairs to avoid premature signals. Others keep the classic +100 and -100. The smartest move is to test settings on historical data for your chosen pairs before risking real money. Settings that work on EUR/USD may behave differently on a volatile pair like GBP/JPY or on gold.
CCI Trading Strategies That Work
The cleanest entry method is the zero line cross combined with the extreme levels. When the line crosses above zero and then pushes through +100, momentum has turned bullish, and you have a structured reason to look for longs. When it crosses below zero and breaks -100, momentum favors shorts. This approach keeps you on the side of the prevailing force rather than fighting it. Add a trend filter, such as a moving average on price, and you avoid taking signals against the dominant direction.
A second reliable approach is the overbought and oversold reversal, best used in ranging markets. When a pair is stuck between clear support and resistance, a CCI reading above +100 near resistance hints at a fade back into the range. A reading below -100 near support hints at a bounce. The trick is to wait for the line to start curling back from the extreme rather than entering the instant it touches it. Patience here separates winning fades from painful early entries.
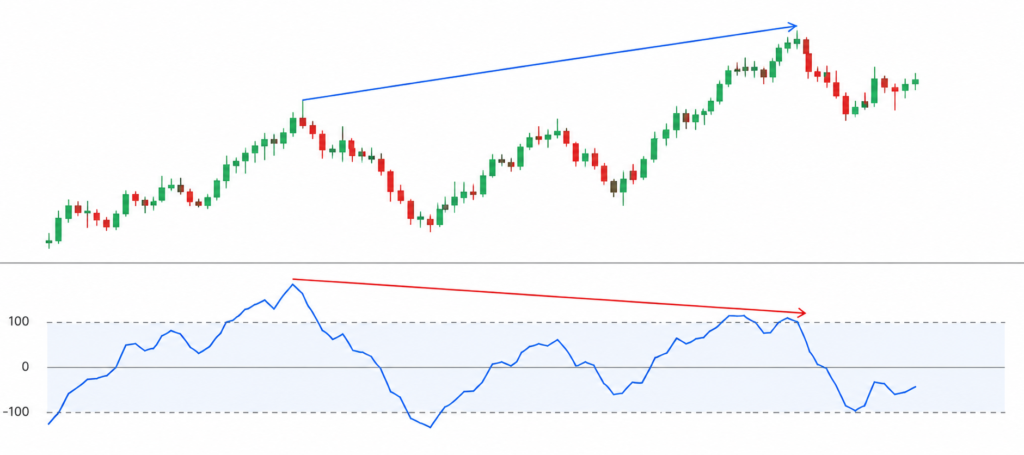
The third and arguably most powerful technique is divergence. Divergence occurs when price makes a new high but the CCI makes a lower high, signaling that momentum is fading even as price climbs. The reverse, a new price low with a higher CCI low, warns of a possible bottom. Divergence often appears before major reversals, which makes it a favorite among experienced traders. Hidden divergence, where the indicator disagrees with a pullback inside a trend, can also flag strong continuation entries. Combine any of these strategies with clean price action, and your cci forex strategy gains real teeth.
Combining CCI With Other Indicators
No oscillator should trade alone, and the CCI is no exception. Pairing it with a trend tool gives you both direction and timing. A simple moving average or the relationship between two moving averages tells you the overall trend, while the CCI tells you when momentum aligns with that trend. If the trend is up and the CCI dips into oversold then recovers, you have a high quality pullback entry in the direction of the larger move. This pairing filters out many of the weak signals that hurt traders who rely on a single tool.
Many traders also compare the CCI with the RSI or stochastic oscillator. Each measures momentum slightly differently, so agreement between them strengthens a signal. If two independent indicators flash the same warning at the same level, the case for action is stronger than one alone. That said, stacking too many oscillators creates clutter and conflicting signals. Two complementary tools usually beat five overlapping ones. Keep your chart clean enough to think clearly.
Price action remains the most important partner of all. The CCI confirms what candles, levels, and chart patterns already suggest. A bullish divergence at a major support zone carries far more weight than the same divergence floating in empty space. A break above +100 right as price clears resistance is a textbook continuation cue. When the indicator and the structure of the market tell the same story, your conviction and your odds both rise. This article is educational and not financial advice; always test any approach before trading live.

Managing Risk With CCI Signals
Even the best signal fails sometimes, so risk management decides whether you survive long enough to profit. The CCI helps here too. Because it marks momentum extremes, it can guide logical stop placement. If you enter a long on an oversold bounce, a sensible stop sits just below the swing low that produced the signal. If momentum was truly turning, price should not revisit that low. If it does, your read was wrong, and a tight stop limits the damage.
Position sizing matters more than any single entry. Risk only a small, fixed percentage of your account on each trade, and your edge has room to play out across many trades. The CCI gives you frequent signals, which tempts overtrading. Resist that pull. Take only the setups that align with your trend filter and your strategy rules. Quality beats quantity every time you sit down at the charts. A clear plan keeps emotion out of the decision and protects your capital.
Finally, define your exit before you enter. The CCI can signal exits as well as entries. A long taken near oversold can be trimmed or closed when the line reaches the opposite extreme, or when divergence appears against your position. Locking in gains with rules, rather than hope, is what turns a good indicator into a profitable system. The market rewards discipline far more than it rewards clever entries.
Common Mistakes Traders Make With CCI
The most frequent error is treating every extreme reading as an automatic reversal signal. In a strong trend, the line can stay overbought for a long time while price keeps climbing. Traders who short every +100 reading in a powerful uptrend get run over again and again. The fix is simple: identify the trend first, then decide whether to fade extremes or ride them. Context turns a noisy indicator into a precise one.
Another common slip is ignoring the timeframe. A signal on a one minute chart carries far less weight than the same signal on a daily chart. Beginners often trade tiny timeframes where noise overwhelms the signal, then blame the indicator. Stepping up to a higher timeframe usually cleans up the picture dramatically. Many seasoned traders confirm the higher timeframe trend, then drop down to time their entries. This multi timeframe habit cuts down on whipsaws.
The third mistake is abandoning a setting after a few losses. Every strategy has losing streaks, and switching settings constantly guarantees you never learn what actually works. Pick a configuration, test it honestly over a meaningful sample, and judge it on the full results, not the last three trades. Discipline and patience, not endless tinkering, build the consistency that separates profitable traders from the rest.
What Top Traders and Research Say
Serious study of momentum tools rewards every trader. John Murphy, in his classic Technical Analysis of the Financial Markets, explains how oscillators like the CCI help traders gauge overbought and oversold conditions and confirm trends, and he credits Donald Lambert with creating the Commodity Channel Index in 1980. Murphy’s work remains a respected foundation for anyone learning how indicators fit into a complete trading approach. It places the CCI within a broader toolkit rather than treating it as a magic button.
Academic research offers a sober, balanced view. In their well-known study “Foundations of Technical Analysis,” Lo, Mamaysky, and Wang (2000) found that some technical patterns do carry measurable, practical information, lending credibility to disciplined chart-based methods. At the same time, Barber and Odean’s influential paper “Trading Is Hazardous to Your Wealth” showed that excessive, overconfident trading tends to erode returns. Together these findings deliver a clear message: technical tools can add value, but only when paired with patience and restraint.
The wisdom of great traders echoes the same theme. As Paul Tudor Jones famously put it, “The most important rule of trading is to play great defense.” An indicator like the CCI can sharpen your offense, yet the traders who last are the ones who protect their capital first. Let the oscillator guide your timing, but let risk discipline guide your survival.
Frequently Asked Questions
What is the best CCI setting for forex trading?
There is no single best number, but the 14-period CCI is the most popular default, and many swing traders prefer the 20-period for smoother signals. The right cci indicator settings for forex depend on your timeframe and style. Scalpers shorten the period for speed, while position traders lengthen it for stability. Always backtest your chosen setting on the pairs you trade before going live.
How do I read overbought and oversold levels on the CCI?
Readings above +100 suggest strong upward momentum or overbought conditions, while readings below -100 suggest strong downward momentum or oversold conditions. In ranging markets these extremes often hint at reversals, but in trending markets they confirm strength. Reading them correctly in context is the core skill of commodity channel index forex trading.
Is the CCI better than the RSI for forex?
Neither is strictly better; they measure momentum in slightly different ways. The CCI reacts to how far price strays from its average, while the RSI measures the speed of recent gains and losses. Many traders use both together, treating agreement between them as a stronger signal. Choose the one that fits your strategy and that you understand deeply.
Can beginners use the CCI indicator effectively?
Yes, the CCI is beginner-friendly because its signals are visual and intuitive. Start with the standard 14-period setting and the +100 and -100 levels on a higher timeframe to reduce noise. Focus on one clear strategy, such as zero line crosses with a trend filter, before adding divergence. Practice on a demo account until the signals feel natural.
What is CCI divergence and why does it matter?
Divergence happens when price and the CCI move in opposite directions, such as price making a new high while the indicator makes a lower high. It often warns that momentum is fading before price actually reverses. This makes divergence one of the most valuable early signals in a cci forex strategy. Confirm it with support, resistance, or price action for the best results.
Does the CCI work on all currency pairs and timeframes?
The CCI works across major, minor, and exotic pairs, as well as on gold and indices. However, volatile pairs may need wider levels like +200 and -200 to avoid false signals. Higher timeframes generally produce cleaner, more reliable readings than very short ones. Test the indicator on each market and timeframe you plan to trade.
Final Thoughts
The CCI is a deceptively simple tool that rewards traders who learn to read it in context. It measures how far price has stretched from its average, flagging momentum, exhaustion, and the early signs of reversal across every currency pair. Used well, cci indicator forex trading gives you a structured way to time entries, confirm trends, and spot divergence before the crowd. The keys are matching your settings to your style, combining the indicator with price action and a trend filter, and never trading without firm risk management. Remember that no indicator wins every time; discipline and patience turn a good signal into a profitable habit. This guide is educational and not financial advice, so test everything before risking real capital. For more practical strategies, settings guides, and chart-ready trading insights, keep learning and growing your edge with forextradingboards.com.