
Introduction
Forex trading confluence zones are the price areas where several independent signals line up and point to the same decision. When a moving average, a Fibonacci level, a round number, and a trendline all cluster within a few pips, the market is telling you something worth listening to. Most losing traders enter on a single reason, then wonder why their stop gets hit. Confluence flips that habit. In this guide, you will learn what confluence really means, how to find confluence in forex charts across timeframes, and which factors carry the most weight. You will also get a practical confluence trading checklist forex scoring system, a real-data look at what research says, and answers to the questions traders ask most. By the end, you can mark a zone, count the reasons, and decide whether a setup deserves your risk.
What Confluence Actually Means in Forex
Confluence is simple at its core. It is the point where two or more separate analysis methods agree. Think of a river. Several streams flow in from different directions and meet at one place. That meeting point holds more water, more force, and more momentum than any single stream. Price reacts the same way when independent signals converge.
A single signal is weak because it can fail for ordinary reasons. A lone trendline can break. A single Fibonacci level can get pierced. A round number can be swept. But when a trendline, a Fibonacci retracement, and a round number all sit within a tight band, the odds shift. Many traders are watching the same area. Their orders cluster there. That clustering creates real buying or selling pressure, and it shows up as a clean reaction on the chart.
The key word is independent. Two moving averages drawn from the same data are not true confluence. They measure the same thing twice. Real confluence comes from different categories of evidence: structure, momentum, time, and price behavior. When evidence from separate categories agrees, the conclusion is far more reliable than when one category screams alone. This is why confluence is a probability tool, not a certainty tool. It does not guarantee a win. It stacks the odds in your favor so that, across many trades, your edge compounds.
How to Find Confluence in Forex Charts
Learning how to find confluence in forex starts with a clean chart. Strip away the clutter. Too many indicators create noise, and noise hides the signal. Begin with raw price structure. Mark the obvious swing highs and swing lows. These are the levels the whole market sees, so they matter most. Draw horizontal lines across the points where price has reversed more than once. Those repeated reactions are your anchor.
Next, add one structural tool at a time and watch for overlap. Drop a Fibonacci retracement from the last major swing. Note where the 61.8% and 50% levels land. If a Fibonacci level rests right on top of a horizontal support line, you have your first true confluence. Then add a moving average that you trust, such as the 50 or 200 period. If that average glides into the same zone as price approaches, the case strengthens again.
Round numbers and psychological levels deserve attention too. Price often hesitates at levels like 1.1000 or 1.2500 because large orders and stop clusters gather there. When a round number coincides with structure and a Fibonacci level, the zone becomes hard to ignore. The goal is not to force every tool to agree. It is to let the chart reveal where agreement already exists naturally. You are a detective collecting evidence, not a lawyer arguing a predetermined case.
Finally, define the zone, not the line. Confluence rarely lands on a single pip. It forms a band, often ten to thirty pips wide depending on the pair and timeframe. Mark that band with a rectangle. This keeps your expectations realistic and your stop placement sensible. Price can wick through a level and still respect the zone.
The Power of Multi-Timeframe Confluence
Timeframe alignment is one of the strongest forms of confluence, and many traders underuse it. The idea is straightforward. A level that appears on the four-hour chart carries more weight if it also appears on the daily chart. The higher timeframe sets the dominant bias, while the lower timeframe gives you a precise entry.
Start at the top. Open the daily or weekly chart and identify the major zones and the overall trend. This is your context. Then drop down to the four-hour or one-hour chart to refine your view. When the lower timeframe pulls back into a higher timeframe level, you get the best of both worlds: the strength of a major level and the precision of a tight entry. This stacking of timeframes filters out countless low-quality setups that look tempting on a single chart but ignore the bigger picture.
Trading against the higher timeframe is one of the most common mistakes new traders make. A bullish setup on the fifteen-minute chart means little if the daily trend is firmly down and price sits below major resistance. Multi-timeframe confluence forces you to respect the larger flow. It keeps you trading with the current, not against it, and that single discipline can transform an inconsistent account into a steady one.

Building a Confluence Trading Checklist
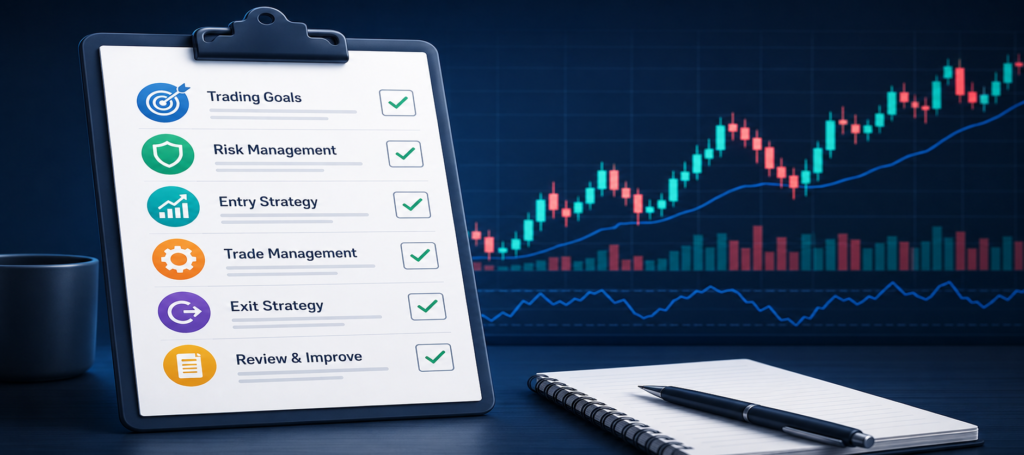
A reliable confluence trading checklist forex turns a vague gut feeling into a repeatable process. The aim is to score each setup objectively before you risk a cent. Assign points to each factor you see, then set a minimum threshold. If a setup scores below your threshold, you skip it. This single rule eliminates most impulsive trades.
The table below shows a sample scoring framework. Adjust the weights to fit your own tested strategy, but keep the structure. The discipline of counting reasons, rather than feeling them, is what separates consistent traders from gamblers.
| Confluence Factor | What to Look For | Score |
|---|---|---|
| Higher timeframe trend | Setup aligns with daily/weekly direction | 3 |
| Key support or resistance | Price at a proven multi-touch level | 3 |
| Fibonacci level | 50% or 61.8% retracement overlaps the zone | 2 |
| Round/psychological number | Major figure like 1.2000 nearby | 1 |
| Moving average | 50 or 200 MA reinforces the zone | 2 |
| Candlestick signal | Pin bar, engulfing, or rejection wick | 2 |
| Momentum or divergence | RSI divergence or clear momentum shift | 2 |
| Session timing | Setup forms in London or New York session | 1 |
With this framework, a setup scoring six or higher might qualify as a valid trade, while anything lower waits on the sidelines. The exact cutoff is yours to test. What matters is that you commit to it. A checklist removes emotion from the moment of decision. You stop asking “do I feel good about this?” and start asking “does this meet my standard?” That shift is quiet, but its effect on a trading account is enormous.

The Most Reliable Confluence Factors Ranked
Not all confluence is equal. Some factors deserve more weight because more market participants watch them and act on them. At the top sits market structure: the swing highs and lows that define support and resistance. These levels are visible to everyone, from retail traders to institutions, so they attract the most orders. A clean, multi-touch level is the strongest single piece of evidence you can find.
Fibonacci retracements rank highly too, especially the 61.8% and 50% levels. They work partly because so many traders use them, creating a self-fulfilling reaction. When a Fibonacci level overlaps a structural level, the combination is powerful. Moving averages, particularly the 200-period on higher timeframes, also command respect because large funds and algorithms reference them for trend definition.
Lower on the list, but still useful, are round numbers, session timing, and candlestick patterns. These are confirmation factors rather than primary evidence. A pin bar alone is weak. A pin bar that forms exactly at a daily support level during the London session is strong. The lesson is to lead with structure and momentum, then let lighter factors confirm rather than drive your decision. Build your zone on bedrock, then add the finishing touches.
Common Mistakes That Ruin Good Confluence
Even traders who understand confluence sabotage themselves with avoidable errors. The first is overloading the chart. Adding twenty indicators does not create twenty independent signals. It creates redundancy and analysis paralysis. Many of those tools measure the same underlying data, so they agree by design, not by genuine confirmation. Keep your toolkit small and meaningful.
The second mistake is forcing confluence where none exists. When traders want a trade badly enough, they bend the evidence to fit. They stretch a trendline, pick a convenient Fibonacci anchor, and call it a setup. This is confirmation bias in action, and it is expensive. Real confluence is found, not manufactured. If you have to squint to see it, it probably is not there.
A third error is ignoring the higher timeframe context, which we covered earlier but which bears repeating because it is so costly. A fourth is treating confluence as a guarantee. Even an A-plus zone with six aligned factors can fail. That is normal. Confluence improves your win rate and your risk-to-reward, but no setup wins every time. Traders who expect certainty abandon the method after one loss and return to random entries. The edge only appears across a large sample, so you must trade your process patiently and let probability do its work.
Turning Confluence Zones into a Trade Plan
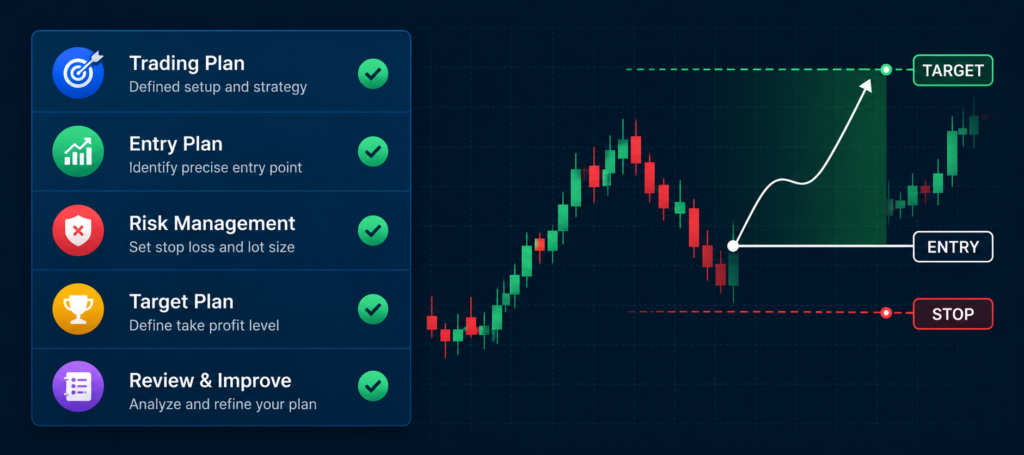
Spotting a zone is only half the job. You also need a plan for entry, stop, and target. The zone itself defines your reference. For entry, wait for price to reach the zone and then show a reaction. A rejection wick, an engulfing candle, or a clear momentum shift on a lower timeframe gives you a trigger. Entering blindly at a level is risky; entering on confirmation at a level is disciplined.
Your stop belongs just beyond the zone, not inside it. Because confluence forms a band, place your stop on the far side of that band so a normal wick does not knock you out. This is why marking a rectangle matters more than drawing a single line. A sensible stop respects the structure and gives the trade room to breathe while still capping your loss.
For targets, lean on the next opposing confluence zone. If you buy at support confluence, your logical exit is the next resistance confluence above. This keeps your risk-to-reward grounded in the chart rather than in hope. A setup that offers only a one-to-one reward is rarely worth taking, even with strong confluence. Aim for at least two-to-one, and let the zones define where price is likely to stall. When entry, stop, and target all derive from the same confluence logic, your plan becomes coherent and repeatable.
What Top Traders and Research Say
The confluence mindset is grounded in respected work. In Technical Analysis of the Financial Markets, John Murphy stresses that the strongest signals appear when multiple tools confirm one another, a principle that sits at the heart of confluence trading. His framework of combining trend, support and resistance, and indicators is essentially a confluence argument written long before the term became popular among retail traders.
Academic research also supports the value of disciplined pattern reading. In their 2000 Journal of Finance study, Andrew Lo, Harry Mamaysky, and Jiang Wang found that several technical patterns carried measurable, statistically significant information about future returns. Their work suggests that structured technical analysis, when applied rigorously, is more than superstition. Separately, the research of Brad Barber and Terrance Odean on individual investors showed that overtrading and impulsive entries erode returns, which is exactly the behavior a confluence checklist is designed to prevent.
The psychology matters as much as the method. As Mark Douglas, author of Trading in the Zone, put it: “Anything can happen.” That short reminder keeps confluence in perspective. You stack the odds, then accept the uncertainty of any single trade.
Frequently Asked Questions
What are forex trading confluence zones? Forex trading confluence zones are price areas where several independent signals agree at once. A zone might combine support, a Fibonacci level, a moving average, and a round number. Because many traders watch these overlapping levels, their orders cluster there. That clustering creates stronger reactions, making confluence zones higher-probability areas to plan entries and exits than any single level alone.
How do I find confluence in forex without overcomplicating my charts? Start with clean price structure and mark proven swing highs and lows. Then add one tool at a time, such as a Fibonacci retracement or a key moving average, and look for natural overlap. Learning how to find confluence in forex is about spotting agreement that already exists, not forcing tools to line up. Keep your indicator list short to avoid noise.
How many confluence factors make a good trade? There is no fixed number, but a useful confluence trading checklist forex rule is to require a minimum score before entering. Many traders look for at least three to four independent factors, weighted by importance. Structure and higher-timeframe trend should carry the most weight, while round numbers and timing act as lighter confirmation. Test your own threshold and stick to it.
Does confluence guarantee a winning trade? No. Confluence improves probability, not certainty. Even a setup with several aligned factors can fail because markets are uncertain by nature. The advantage shows up across many trades, not on any single one. Treat confluence as a filter that raises your win rate and your risk-to-reward over time, and accept that individual losses are a normal part of the process.
Can I use confluence for both scalping and swing trading? Yes. The principle scales across styles. Scalpers find confluence on lower timeframes like the five-minute and one-minute charts, while swing traders build zones from the four-hour, daily, and weekly charts. The factors stay the same: structure, Fibonacci, moving averages, momentum, and timing. Only the timeframes change, so the method adapts to whatever pace you trade.
Final Thoughts
Confluence is the difference between trading on a hunch and trading with a plan. When you mark a zone where structure, Fibonacci, moving averages, and momentum all agree, you are no longer guessing. You are counting reasons and only acting when the evidence is strong enough to justify your risk. The method demands patience and a clean chart, but it rewards you with fewer, higher-quality setups and a calmer decision process. Build your checklist, respect the higher timeframe, define your zones as bands, and plan your entry, stop, and target from the same logic. Do that consistently, and your edge has room to compound. This article is educational and not financial advice; always test any approach and manage your risk before trading live. Ready to sharpen your edge with more practical strategies and chart breakdowns? Visit forextradingboards.com for in-depth guides, real-market analysis, and tools to help you trade confluence zones with confidence.