
Introduction
The ict daily bias is the single decision that shapes every trade you take before the session even opens. It answers one question: is price more likely to draw higher or lower today, and which liquidity pool will it seek? Traders who follow the Inner Circle Trader methodology treat this directional read as their foundation. Everything else, from entries to targets, flows from it. In this guide, you will learn exactly what is daily bias in trading, why it separates consistent traders from gamblers, and how to determine daily bias ict style using higher-timeframe structure, previous day high and low, order blocks, fair value gaps, and premium versus discount. We will walk through a clean top-down routine, share a practical checklist, cover the mistakes that ruin most bias reads, and close with research-backed insight. Read on, and you will trade with a plan, not a hunch.
What Is Daily Bias in Trading?
Let me start with the plain definition. Daily bias is your expectation of price direction for the trading day. It is a probability-based lean, not a guarantee. When you form a bias, you decide whether you will hunt for buying opportunities or selling opportunities. You do not force trades against it.
In the ICT framework, bias is tied directly to liquidity. Price does not move randomly. It moves to reach pools of resting orders. These pools sit above old highs and below old lows, where stop losses cluster. The ict daily bias is really a forecast of where price wants to draw next. That destination is called the draw on liquidity.
So what is daily bias in trading in practical terms? It is the answer to a question you ask every morning. Will price more likely reach for the liquidity above yesterday’s high, or the liquidity below yesterday’s low? Once you answer that, your entire day gains structure. You wait for price to trade to a level that aligns with your bias, then you look for a precise entry.
A bias is dynamic. It can be invalidated during the session. If price breaks a key structural level against your read, you adjust. Good traders hold their bias loosely enough to change but firmly enough to stay disciplined.
Why Daily Bias Matters More Than Your Entry
Most beginners obsess over entries. They collect indicators and chase perfect signals. Yet without a directional bias, even a flawless entry is a coin flip. Direction is the edge. Entry is only the execution.
A clear bias filters noise. Markets throw dozens of setups at you every session. When you know the likely draw on liquidity, you ignore setups pointing the wrong way. You stop taking counter-trend trades that feel tempting but fight the day’s flow. This selectivity alone improves results.
Bias also fixes your targets. If you expect price to reach for buy-side liquidity above the previous day high, that level becomes your logical objective. You know where to take profit before you even enter. This removes the guesswork and the emotional exit decisions that wreck many traders.
Finally, a defined bias builds patience. When you commit to a direction, you wait for price to come to your zones. You are no longer reacting to every tick. You are executing a plan. That psychological shift is worth more than any indicator.
How to Determine Daily Bias ICT: The Top-Down Method
Now to the core skill. Learning how to determine daily bias ict style means working from the highest timeframe down to the level where you trade. Never start on the 5-minute chart. Context comes from above.
Begin on the weekly and daily charts. Identify the broader trend. Is price making higher highs and higher lows, or lower highs and lower lows? Note the most recent significant swing points. These swings tell you the prevailing direction and where major liquidity rests.
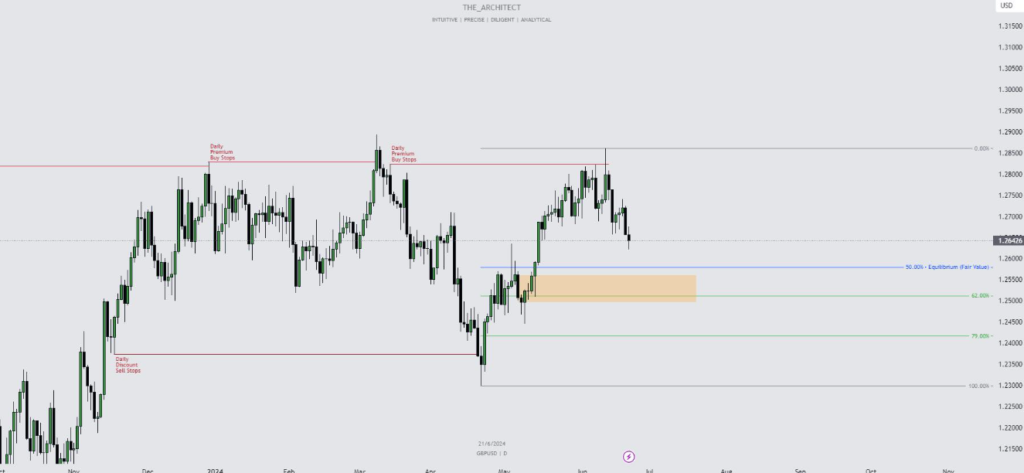
Next, map the dealing range. Find a clear recent swing high and swing low. The midpoint of that range is equilibrium. Above equilibrium is premium, where price is expensive and favors selling. Below equilibrium is discount, where price is cheap and favors buying. This premium and discount concept is central to ICT and refines your bias immediately.
Then drop to the 4-hour and 1-hour charts. Look for the most recent market structure shift or break of structure. A bullish break of structure suggests buyers have taken control and price may seek higher liquidity. A change of character in the opposite direction warns that momentum is flipping. These structural clues sharpen the directional lean you formed on the higher timeframe.
Finally, mark your key reference levels for the day. These include the previous day high and low, the new week opening gap, unmitigated order blocks, and open fair value gaps. Each of these is a magnet or a barrier. Together, they frame where price is likely to go and where it might reverse.
Using PDH, PDL, and the Draw on Liquidity
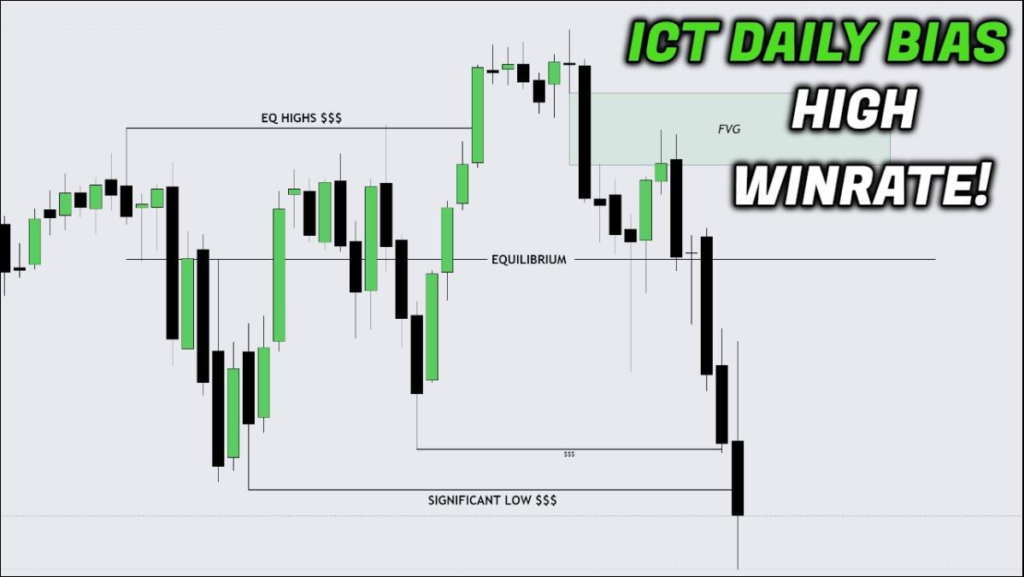
The previous day high and previous day low are the workhorses of a daily bias. Traders and algorithms watch these levels closely because resting orders accumulate near them. Above the PDH sits buy-side liquidity. Below the PDL sits sell-side liquidity.
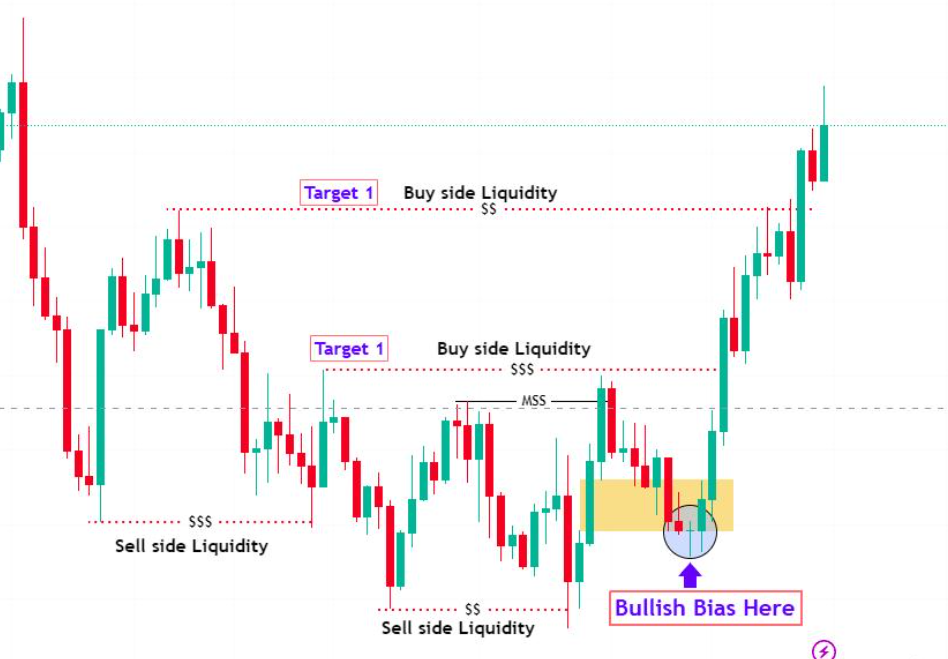
Your job is to judge which pool price wants next. If the higher-timeframe trend is bullish and price sits in discount, the draw on liquidity is likely the buy-side above the previous day high. Your bias is bullish. You wait for price to trade into a discount zone, then look for longs targeting that high.
The opposite holds for a bearish read. When the trend points down and price trades in premium, the likely draw is the sell-side below the previous day low. Your bias is bearish, and you hunt for shorts.
Watch for liquidity sweeps. Price often spikes just beyond a prior high or low to grab stops, then reverses hard. This is a classic ICT signature. A sweep of the previous day low followed by a sharp bullish reaction can confirm a bullish bias, because smart money accumulated positions by triggering those stops. Reading these sweeps well is a major edge.
Premium vs Discount: Buying Low and Selling High
Premium and discount deserve their own focus because they prevent a common error, chasing price. When you buy in premium or sell in discount, you enter at a poor price and take on unnecessary risk.
Draw your dealing range from a meaningful swing low to a meaningful swing high. The 50 percent level is equilibrium. Only look for longs when price trades in the lower half, the discount region. Only look for shorts when price trades in the upper half, the premium region. This single rule keeps your entries efficient.
Combine premium and discount with your bias for confluence. A bullish bias plus a discount price is a high-quality condition. A bearish bias plus a premium price is equally strong. When these align, your setups carry more weight. When they conflict, you stand aside or wait for price to reach the correct zone.
Order blocks and fair value gaps often live inside these zones. A bullish order block sitting in discount is a prime area to look for longs. A bearish fair value gap in premium is a natural place to consider shorts. This is where bias, structure, and price levels come together into an actual trade.
Bullish vs Bearish Daily Bias Checklist
Use the table below as a quick pre-market reference. Score the signals. When most point the same way, your ict daily bias is clear. When they conflict, expect a range or wait for clarity.
| Signal | Bullish Daily Bias | Bearish Daily Bias |
|---|---|---|
| Higher-timeframe structure | Higher highs and higher lows | Lower highs and lower lows |
| Price within dealing range | Trading in discount (below equilibrium) | Trading in premium (above equilibrium) |
| Draw on liquidity | Buy-side above previous day high | Sell-side below previous day low |
| Recent structure event | Bullish break of structure | Bearish break of structure |
| Liquidity sweep | Sell-side swept, sharp bullish reaction | Buy-side swept, sharp bearish reaction |
| Order block in play | Unmitigated bullish order block below price | Unmitigated bearish order block above price |
| Fair value gap | Bullish FVG acting as support | Bearish FVG acting as resistance |
| New week opening gap | Price respecting NWOG as support | Price respecting NWOG as resistance |
Common Mistakes That Ruin Your Bias
The first mistake is forming a bias and then marrying it. Markets change. If price breaks structure against your read, respect that signal and adjust. Stubbornness costs money.
The second mistake is skipping the higher timeframe. Traders who form bias on a 15-minute chart get whipsawed. Context must come from the weekly, daily, and 4-hour charts first. Without it, you are trading noise.
A third error is ignoring premium and discount. Buying at the top of a range because momentum looks strong feels natural but usually ends badly. Discipline around equilibrium protects you from chasing.
The fourth mistake is confusing a liquidity sweep with a genuine breakout. A spike beyond the previous day high can be a trap that reverses. Wait for confirmation, such as a break of structure back in your direction, before committing.
Finally, many traders overload the chart. They mark every gap, block, and level until the screen is unreadable. Keep it clean. A handful of high-quality references beats a cluttered mess. Simplicity sharpens decisions.
A Practical Daily Bias Routine
Consistency comes from a repeatable process. Here is a compact routine you can run in fifteen minutes before the session, so nothing important gets missed.
- Review weekly and daily structure, mark swing points, then define the dealing range and equilibrium. Note PDH and PDL, mark the NWOG, identify unmitigated order blocks and open fair value gaps, judge the likely draw on liquidity, form your bias, and set your invalidation level.
Once the routine is done, write your bias in one sentence. For example, “Bullish today, expecting a draw to buy-side above the previous day high, favoring longs from discount order blocks.” That single line keeps you focused all day.
During the session, let price come to you. If the London or New York killzone delivers a setup that aligns with your bias and sits in the right premium or discount zone, execute. If price violates your invalidation level, stand down or flip your read. The routine turns a vague feeling into a documented, testable plan you can review and improve over time.
What Top Traders and Research Say
For a rigorous foundation in reading market direction, John Murphy’s classic Technical Analysis of the Financial Markets remains essential. It grounds concepts like trend, support, resistance, and swing structure that underpin any daily bias process, ICT-based or otherwise. Understanding structure from a proven text keeps your bias objective rather than imaginative.
On the research side, the landmark study by Andrew Lo, Harry Mamaysky, and Jiang Wang, “Foundations of Technical Analysis” (Journal of Finance, 2000), used rigorous statistical methods to show that certain technical patterns carry genuine, measurable information. That academic support matters. It suggests that reading price structure, the heart of forming a bias, is not superstition when applied with discipline.
Finally, a reminder on mindset from trader Jesse Livermore: “The big money is not in the buying and the selling, but in the waiting.” Bias gives you the conviction to wait for the right side of the market instead of forcing trades. Patience, backed by structure and evidence, is the edge.
Suggested Images
Image alt: Annotated daily chart showing ict daily bias with premium, discount, and equilibrium marked.
Image alt: Infographic comparing bullish vs bearish daily bias signals in ICT trading.
Image alt: Diagram of previous day high and low with buy-side and sell-side liquidity pools.
Image alt: Flowchart illustrating how to determine daily bias ict step by step before the session.
Frequently Asked Questions
What is daily bias in trading? Daily bias is your directional expectation for the trading day. It is a probability-based lean on whether price will more likely move up or down and which liquidity pool it will target. In the ICT method, bias ties to the draw on liquidity, above old highs or below old lows. It guides which setups you take and which you ignore, giving your session structure and discipline.
How to determine daily bias ICT style, step by step? Start on the weekly and daily charts to read the trend and mark swing points. Define the dealing range and equilibrium, then judge whether price sits in premium or discount. Mark the previous day high and low, note order blocks and fair value gaps, and identify the likely draw on liquidity. Combine these clues into a single directional read, and set an invalidation level.
Can the ict daily bias change during the day? Yes. Bias is dynamic, not fixed. If price breaks a key structural level against your read or delivers a strong change of character, you should reassess. Hold your bias firmly enough to stay disciplined, but loosely enough to adjust when the market clearly signals a shift. Always define your invalidation level in advance so you know exactly when to change your view.
Why does premium and discount matter for bias? Premium and discount tell you whether price is expensive or cheap within a range. Buying in discount and selling in premium keeps your entries efficient and your risk lower. When your bias and the premium or discount zone agree, the setup gains confluence and strength. When they conflict, it is usually better to wait for price to reach the correct zone before acting.
Is daily bias reliable enough to trade? No single tool is guaranteed, and bias is about probability, not certainty. Its reliability rises when higher-timeframe structure, premium and discount, and the draw on liquidity all point the same way. Used with strict risk management and a clear invalidation level, a well-formed ict daily bias meaningfully improves selectivity and consistency over time.
Final Thoughts
Mastering the ict daily bias transforms how you approach every session. Instead of reacting to random signals, you form a clear directional read grounded in higher-timeframe structure, premium and discount, the previous day high and low, and the draw on liquidity. That single decision filters your setups, defines your targets, and builds the patience that separates consistent traders from gamblers. Understanding what is daily bias in trading and, more importantly, knowing how to determine daily bias ict style with a repeatable routine, gives you an edge you can refine for years. Start each morning with the checklist, write your bias in one sentence, and let price come to you. For more practical ICT guides, trading routines, and forex strategy breakdowns, keep learning with us at forextradingboards.com and level up your edge one session at a time.
Related guides: