
Introduction
The ICT optimal trade entry is one of the most talked-about setups in modern forex trading, and for good reason. Developed within Michael J. Huddleston’s Inner Circle Trader methodology, it gives traders a repeatable framework for entering the market at a discount rather than chasing price at the worst possible moment. Instead of guessing where to buy or sell, you wait for price to retrace into a defined Fibonacci zone that aligns with smart-money concepts like liquidity, market structure, and institutional order flow. In this guide, you will learn exactly what is optimal trade entry ict, how the 0.62 to 0.79 retracement zone works, and why the 0.705 “sweet spot” carries so much weight. We will cover the confluence tools that turn a decent entry into a great one, walk through a full ote trading strategy with rules, and look at what serious research and legendary traders say about timing entries with discipline.
Related guides:
What Is Optimal Trade Entry in ICT?
The ICT optimal trade entry describes a precise pocket of price where smart money is presumed to enter a position after an initial impulsive move. The logic is simple but powerful. Markets rarely travel in a straight line. Price pushes hard in one direction, then pulls back before continuing. That pullback is your opportunity. Rather than entering during the impulsive leg, when risk is high and reward is compressed, you wait for price to retrace into a discount area before the trend resumes.
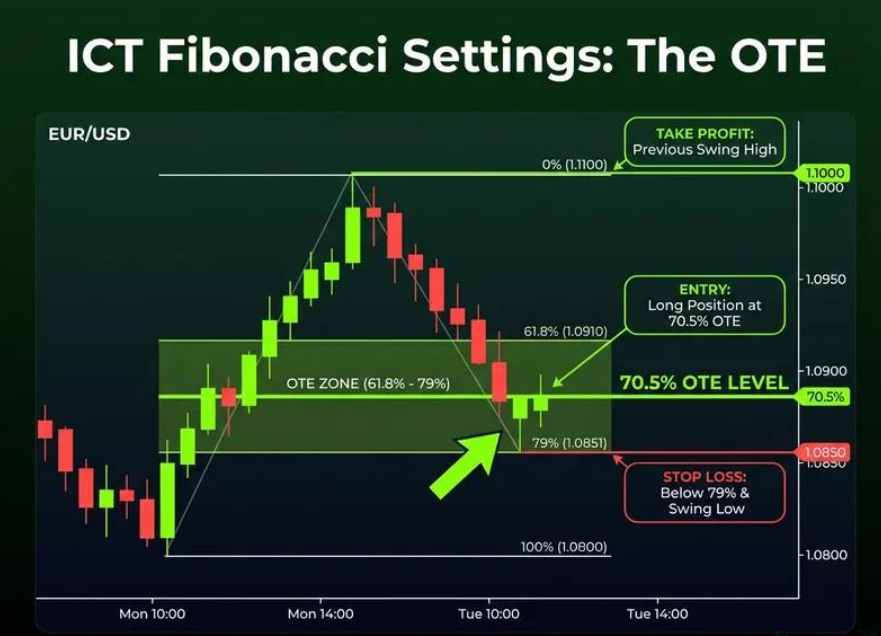
So what is optimal trade entry ict in practical terms? It is the zone between the 0.62 and 0.79 Fibonacci retracement of a defined price leg. When you draw your Fibonacci tool from the start of an impulsive move to its end, the OTE zone sits deep inside that retracement. In a bullish scenario, you measure from the swing low to the swing high, and you look to buy when price sinks back into that 62 to 79 percent band. In a bearish scenario, you flip it, measuring from the swing high to the swing low and selling into the retracement.
This is not arbitrary. The deeper retracement lets you enter closer to the origin of the move, which tightens your stop loss and expands your potential reward. The result is a favorable risk-to-reward profile that many discretionary strategies struggle to match. The OTE is less an indicator and more a location. It tells you where to be interested, not what to blindly click.
The OTE Fibonacci Zone and the 0.705 Sweet Spot
The heart of the ote trading strategy is the Fibonacci retracement, but ICT uses it differently from classic technical analysis. Traditional traders often watch the 0.382, 0.5, and 0.618 levels for shallow pullbacks. ICT flips the emphasis toward the deeper end of the retracement, where institutions are thought to fill orders at a genuine discount in a bullish leg or a genuine premium in a bearish one.
Within that deeper band, one level gets special attention: the 0.705 retracement, widely called the “sweet spot.” It sits almost exactly in the middle of the OTE zone and often acts as the magnet where price stalls before reversing. Many ICT traders set their primary limit order at 0.705 and treat the surrounding levels as the acceptable range. The table below breaks down the levels that matter and how each one is typically used.
| Fibonacci Level | Role in the OTE Framework | Practical Use |
|---|---|---|
| 0.0 | Origin of the impulse leg | Marks where the move began; reference only |
| 0.5 | Equilibrium (premium/discount divider) | Above is premium, below is discount |
| 0.62 | Upper boundary of the OTE zone | First point of interest for entries |
| 0.705 | The “sweet spot” | Preferred limit-order entry level |
| 0.79 | Lower boundary of the OTE zone | Deepest acceptable entry before invalidation |
| 1.0 | End of the impulse leg | Full retracement; setup often invalid beyond |
The zone between 0.62 and 0.79 is the working area, and 0.705 is the anchor. If price blows past 0.79 and keeps going, the original move is likely compromised, and the setup should be reconsidered. This clean invalidation point is part of what makes the OTE so appealing. You always know where you are wrong.
Why the OTE Works: Liquidity and Smart Money Logic
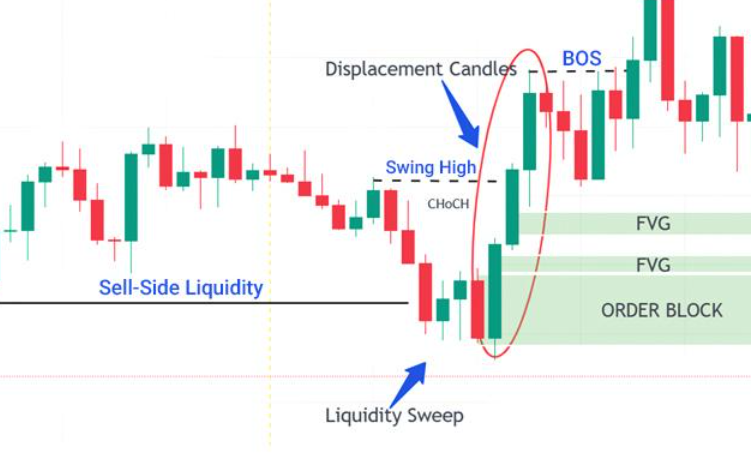
To use the ICT optimal trade entry well, you need to understand the reasoning beneath it. ICT is built on the idea that large institutions move markets and that they need liquidity to fill their sizable orders. Liquidity clusters where retail traders place stops, typically just beyond obvious swing highs and lows. When price sweeps those levels, it triggers a flood of orders that institutions absorb, then price reverses in the intended direction.
The OTE zone frequently forms right after one of these liquidity sweeps. Price grabs the stops resting above a high or below a low, then snaps back and retraces into the discount or premium pocket. That retracement into the 62 to 79 percent band is where the smart-money entry is presumed to happen. By aligning your entry with this behavior, you are trading with the flow of institutional order execution rather than against it.
This is also why the OTE is not meant to be traded in isolation. The Fibonacci zone tells you where, but liquidity context tells you whether. A retracement into the OTE that follows a clean sweep of resting liquidity is far stronger than one that appears out of nowhere. The best setups combine a defined draw on liquidity, a shift in structure, and price settling neatly into the sweet spot.
Market Structure Shift: The Trigger That Validates OTE
A Fibonacci zone alone is not a signal. What transforms a passive retracement into an actionable ote trading strategy is the market structure shift, sometimes called a change of character. This is the moment price breaks a recent structural point in the opposite direction of the prior move, signaling that momentum has flipped.
Picture a downtrend making lower highs and lower lows. Price then sweeps the sell-side liquidity below the last low and, instead of continuing down, rallies sharply and breaks above the most recent lower high. That break is your market structure shift. It confirms buyers have stepped in with force. Only after this shift do you draw your Fibonacci from the new swing low to the new swing high and look to buy in the OTE zone on the pullback.
The displacement that creates the shift matters too. ICT traders look for an aggressive, one-sided candle sequence rather than a slow drift. Strong displacement usually leaves an imbalance in its wake, which becomes a target for the retracement. When the structure shift, the displacement, and the OTE zone all line up, you have a high-probability sequence rather than a hopeful guess. The shift answers the timing question, while the OTE answers the entry question.
Order Blocks and Fair Value Gaps as Confluence
The strongest ICT optimal trade entry setups stack multiple concepts in the same location. Two of the most important are order blocks and fair value gaps, and both frequently overlap with the OTE zone.
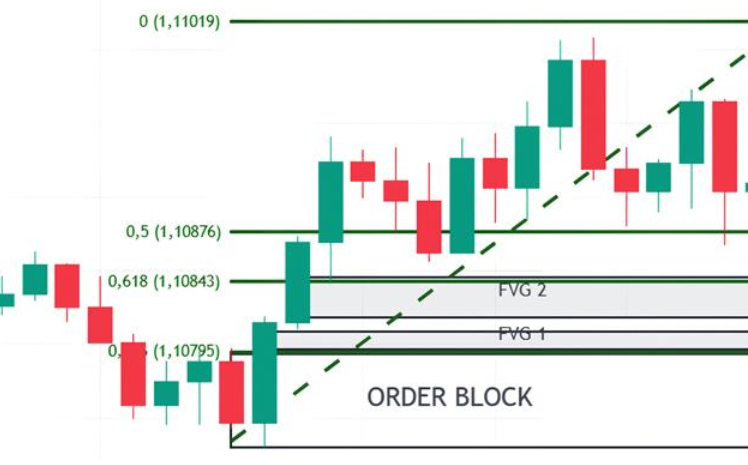
An order block is the last opposing candle before a strong displacement move, and it represents an area where institutions likely placed orders. In a bullish setup, the bullish order block is the last down-close candle before price ripped higher. When that order block sits inside or near your 62 to 79 percent retracement band, the confluence is compelling. You are entering at a Fibonacci discount and at a documented institutional footprint at the same time.
A fair value gap, or imbalance, is a three-candle pattern where price moved so quickly that it left an inefficiency, a gap between the first candle’s wick and the third candle’s wick. Markets tend to return and rebalance these gaps. If a fair value gap overlaps the OTE zone, price often retraces precisely into it before continuing, giving you a razor-sharp entry with a tight invalidation. When an order block, a fair value gap, and the 0.705 sweet spot all converge, you get the kind of layered confirmation that separates a professional entry from a lucky one. The goal is never a single reason to enter but several reasons pointing to the same price.
Building a Complete OTE Trading Strategy
Let us assemble everything into a coherent, rule-based ote trading strategy you can actually follow. The framework works on any pair and any timeframe, though it shines on the 15-minute, 5-minute, and 1-hour charts during active sessions.
First, identify the higher-timeframe bias and the draw on liquidity. Decide where price is likely headed by noting the nearest pool of buy-side or sell-side liquidity that the market seems to be reaching for. This gives your trades direction and prevents you from fighting the dominant flow.
Second, wait for a liquidity sweep followed by a market structure shift on your entry timeframe. The sweep clears resting stops, and the shift confirms intent. Without the shift, you have no confirmation, only a hope.
Third, mark your impulse leg and draw the Fibonacci from its origin to its end. Highlight the 0.62 to 0.79 OTE zone and the 0.705 sweet spot. Look for an order block or fair value gap inside that zone to strengthen the case.
Fourth, place your entry. Conservative traders wait for a lower-timeframe confirmation inside the zone, while aggressive traders set a limit order at 0.705. Your stop loss goes just beyond the origin of the move, typically past the swing that created the leg, or below the order block. Your first target is the opposing liquidity you identified in step one, which often yields a reward of three times your risk or more.
The single most valuable habit is patience. If price does not reach the OTE zone, you simply do not trade. The setup either forms cleanly or it does not, and skipping marginal opportunities is what keeps the strategy’s edge intact over hundreds of trades.
Managing Risk Within the OTE Framework
No entry model survives without disciplined risk management, and the OTE is no exception. The beauty of entering at a deep retracement is a naturally tight stop, but tight stops still get hit. Sizing each trade so that a loss costs a small, fixed percentage of your account, commonly one percent or less, is what allows the favorable risk-to-reward math to compound over time.
Because the OTE gives you defined invalidation, you can predefine your risk to the pip before entering. If price closes beyond the origin of the leg or blows through the 0.79 level and keeps running, the idea is invalidated and you accept the small loss without hesitation. This mechanical clarity removes much of the emotional interference that ruins discretionary traders. It also lets you scale into positions or take partial profits at the first liquidity target while trailing the remainder toward a deeper draw.
Session timing adds another layer of control. ICT traders concentrate on the London and New York killzones, when volatility and institutional participation peak. Trading the OTE during these windows improves the odds that displacement and liquidity runs unfold cleanly. Outside these hours, the same setup can stall in low-volume chop, so filtering by session is itself a form of risk management. Protecting capital is the strategy’s foundation, and the OTE’s structure makes that protection unusually straightforward.
What Top Traders and Research Say
While the ICT framework is relatively modern, its foundations rest on well-established ideas in technical analysis and market psychology. For a grounding in how support, resistance, and retracements behave, John J. Murphy’s Technical Analysis of the Financial Markets remains the definitive reference, and its treatment of Fibonacci retracements underpins the mechanics of the OTE zone.
On the academic side, the influential study by Andrew Lo, Harry Mamaysky, and Jiang Wang, “Foundations of Technical Analysis” (Journal of Finance, 2000), used rigorous statistical methods and found that certain technical patterns do carry measurable, non-random information about future prices. That research lends credibility to the broader premise that structured, repeatable chart-based methods, including retracement-based entries, can add value when applied with discipline.
The psychology behind waiting for the OTE rather than chasing price echoes a timeless piece of trading wisdom. As Jesse Livermore put it, “There is a time to go long, a time to go short and a time to go fishing.” The OTE is a patience strategy at heart. It rewards traders who wait for their pocket of price and punishes those who force entries. Combining Murphy’s technical grounding, Lo and Wang’s empirical support, and Livermore’s discipline gives the method both a practical and a psychological backbone.
Image alt: Diagram of a market structure shift and liquidity sweep leading into an ICT optimal trade entry setup.
Image alt: Infographic showing order block, fair value gap, and OTE zone confluence in an ICT ote trading strategy.
Image alt: Step-by-step flowchart of the optimal trade entry ict process from bias to entry to target.
Frequently Asked Questions
What is optimal trade entry ict in simple terms? The ICT optimal trade entry is a location on the chart where you look to enter a trade after price retraces into the 0.62 to 0.79 Fibonacci zone of an impulsive move. It lets you buy at a discount or sell at a premium, giving a tight stop and a strong risk-to-reward ratio. It works best when paired with a liquidity sweep, a market structure shift, and a nearby order block or fair value gap.
What Fibonacci levels define the OTE zone? The OTE zone runs from the 0.62 to the 0.79 retracement, with 0.705 acting as the “sweet spot.” Many traders place their primary entry order at 0.705 and treat the surrounding levels as the acceptable band. If price moves beyond 0.79 and keeps going, the setup is usually considered invalid.
Is the ote trading strategy suitable for beginners? It can be, but it demands patience and an understanding of market structure first. Beginners should learn to identify swing points, liquidity, and structure shifts before relying on the Fibonacci zone alone. Starting on a demo account and journaling every OTE setup is the fastest way to build the pattern recognition the method requires.
Do I need indicators to trade the OTE? No special indicator is required. The core tools are the Fibonacci retracement, price structure, and your read of liquidity, order blocks, and fair value gaps. The OTE is a location-based concept, so clean charts and disciplined marking of levels matter far more than any add-on indicator.
What is the best timeframe for ICT optimal trade entry? Many traders find the 15-minute and 5-minute charts ideal for entries, using the 1-hour or 4-hour chart to set directional bias. The setup performs best during the London and New York killzones, when volatility and institutional flow are strongest. Lower timeframes offer precision, while higher timeframes give context.
How do I set stops and targets with the OTE? Place your stop loss just beyond the origin of the impulse leg or the protective order block, so the trade is invalidated cleanly if wrong. Target the opposing liquidity pool you identified as the draw on liquidity, which often delivers three or more times your risk. Scaling out at the first target while trailing the rest is a common way to manage the trade.
Final Thoughts
The ICT optimal trade entry endures because it answers the two hardest questions in trading at once: where to enter and where you are wrong. By waiting for price to retrace into the 0.62 to 0.79 Fibonacci zone, anchoring on the 0.705 sweet spot, and demanding confluence from liquidity sweeps, market structure shifts, order blocks, and fair value gaps, you replace guesswork with a repeatable process. The method will not fire on every candle, and that restraint is precisely its strength. Traders who respect the setup, size their risk conservatively, and trade during the high-liquidity killzones give themselves a genuine edge that compounds across many trades. Learn the mechanics, backtest them until the pattern becomes second nature, then apply them with the patience the strategy demands. If you found this guide useful and want more practical, no-nonsense forex breakdowns like this, visit forextradingboards.com for deeper tutorials, chart walkthroughs, and strategy guides that help you trade with confidence.
Disclaimer: This article is for educational purposes only and does not constitute financial or investment advice. Trading forex carries significant risk, and past performance does not guarantee future results. Always do your own research and consider consulting a licensed professional before making trading decisions.