
Introduction
Liquidity void trading has become one of the most talked-about concepts in modern price-action circles, especially among traders who follow the ICT (Inner Circle Trader) methodology. At its core, a liquidity void is a zone on the chart where price moved so fast in one direction that it left almost no two-sided trading behind. This single-sided delivery creates an inefficiency the market tends to revisit. In this guide, you will learn exactly what a liquidity void is, how it forms, and why price so often returns to “fill” or rebalance it. We will also clarify how a void relates to fair value gaps and imbalances, how to spot one on any timeframe, and how to build a complete trading plan around it, including entries, targets, stop placement, and confluence with order blocks and market structure. Expect practical, accurate detail throughout.
What Is a Liquidity Void in Trading?
To understand what is liquidity void in trading, picture a moment when a market prints a large, aggressive candle. Price surges from one level to another with barely a pause. During that surge, buyers and sellers do not trade evenly across every price. Instead, one side dominates completely. The result is a stretch of the chart where price passed through quickly but very little actual two-sided business took place. That stretch is the liquidity void.
Think of a normal, healthy market as an auction. At each price level, buyers and sellers exchange contracts, leaving a record of genuine interest. A liquidity void breaks that rhythm. It is a region of thin, one-sided delivery, almost like a hole punched through the order flow. Because the market prefers efficiency, it often returns to that hole later to trade through it properly. Traders call this “filling” or “rebalancing” the void.
The concept matters because it reveals intent. A void does not appear by accident. It usually forms when a large participant pushes price with urgency, absorbing everything in the way. That urgency leaves a fingerprint. Learning to read that fingerprint is the foundation of any serious approach to liquidity void trading.
The ICT Liquidity Void Explained
Within the Inner Circle Trader framework, the ict liquidity void carries a specific meaning tied to how algorithms deliver price. ICT teaches that price is engineered, not random, and that markets seek to rebalance inefficiencies over time. A void, in this view, is a clear inefficiency that the algorithm is likely to revisit.
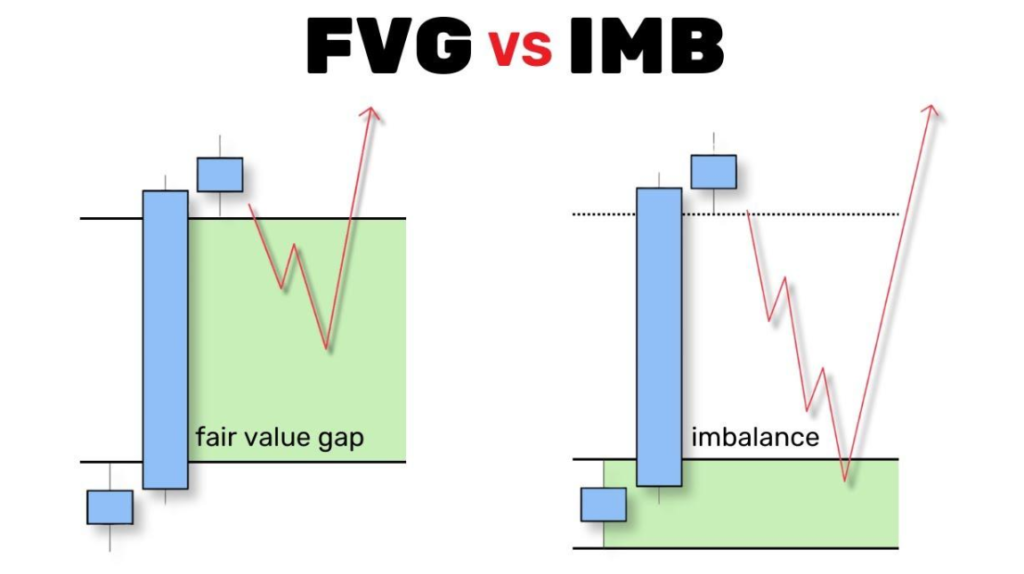
ICT often uses the terms liquidity void, imbalance, and fair value gap in overlapping ways, which confuses newcomers. The cleanest way to frame it is by scale. A fair value gap is the small, precise three-candle inefficiency inside a move. A liquidity void is usually the larger area of one-sided delivery, the broader stretch where price ran without balance. You can think of the fair value gap as a component and the void as the wider region that contains it.
The ICT lens adds a directional story. When price displaces upward and leaves a void behind, the expectation is that price may return down into that void, rebalance it, and then continue in the original direction. This return offers a discounted re-entry. That is why the ict liquidity void is treated less as a barrier and more as an opportunity zone. It marks where smart money likely transacted and where it may transact again.
How a Liquidity Void Forms
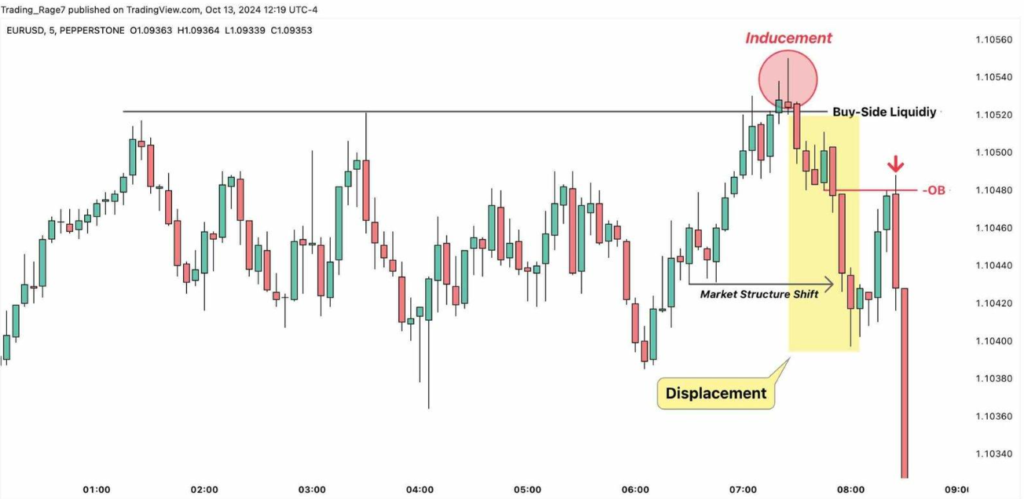
A liquidity void forms during a moment of displacement. Displacement is a strong, decisive move that shifts market structure. It often follows a news catalyst, a liquidity sweep, or a session open when volatility expands. The key ingredient is speed combined with commitment. Price does not drift; it snaps.
During that snap, resting orders on one side get consumed almost instantly. If buyers overwhelm sellers, price leaps upward, and the sellers who would normally trade at each intermediate level never get filled. The candle bodies stretch long, wicks shrink, and consecutive candles point the same way with little overlap. That lack of overlap between candles is the visual signature of the void.
Volume behavior reinforces the story. The initial burst can carry heavy volume as the aggressor pushes through, but the intermediate prices see thin participation because the move is one-directional. This is the single-sided delivery that defines the zone. Once the burst exhausts, price tends to consolidate or pull back, and the untraded pocket sits on the chart waiting. Recognizing that a void has just formed, in real time, is a core skill in liquidity void trading. The moment of displacement is your alert that a rebalancing opportunity may soon develop.
Liquidity Void vs Fair Value Gap vs Imbalance
Traders frequently blur these three terms, so a direct comparison helps. They are related but not identical. A fair value gap is the most precise and mechanical of the three. An imbalance is the underlying market condition. A liquidity void is often the broader zone that houses both. The table below lays out the distinctions clearly.
| Concept | Definition | Typical Size | How It Is Marked | Primary Use |
|---|---|---|---|---|
| Fair Value Gap (FVG) | A three-candle pattern where the wicks of candle one and candle three do not overlap, leaving a gap around candle two | Small, precise | The exact price range between the two non-overlapping wicks | Pinpoint entries and rebalancing targets |
| Imbalance | A general condition where buying and selling pressure were unequal, leaving inefficient delivery | Variable | Often the same range as an FVG, sometimes broader | Diagnosing one-sided order flow |
| Liquidity Void | A larger region created by aggressive displacement with thin two-sided trading | Medium to large | The full stretch of the displacement leg | Framing directional bias and re-entry zones |
The practical takeaway is that these tools stack. A liquidity void gives you the big-picture region of inefficiency. Inside it, one or more fair value gaps give you exact levels to act on. The imbalance is simply the reason the void exists. When you see all three align, the case for a rebalancing move strengthens. This layered reading is where liquidity void trading gains its edge over a single-tool approach.
How to Identify a Liquidity Void on Any Chart
Identifying a void begins with scanning for displacement. Look for a run of candles that move sharply in one direction with long bodies and minimal overlap. The cleaner and faster the move, the clearer the void. On a candlestick chart, the void is the vertical stretch of price that the aggressive leg blew through without meaningful retracement.
Timeframe matters. A void on the one-minute chart is a scalping opportunity that may fill within minutes. A void on the four-hour or daily chart can take days to rebalance but carries far more weight. Higher-timeframe voids tend to act as magnets, quietly pulling price back over many sessions. Align the void’s timeframe with your own trading horizon so your targets and stops make sense.
Precision helps. Mark the high and the low of the void so you have defined boundaries. The midpoint, sometimes called consequent encroachment in ICT language, often acts as a decision point where price either accelerates through or reacts. Watching how price behaves at that midpoint gives early clues about whether a full fill is coming. With practice, spotting voids becomes almost instant, and this speed is what makes liquidity void trading viable in live conditions rather than only in hindsight.
How Price Rebalances a Liquidity Void
The heart of the concept is rebalancing. Because a void represents inefficient, one-sided delivery, the market often returns to trade through it in a more balanced way. When price revisits the void, both buyers and sellers get a chance to transact at prices they were denied during the initial surge. Once that two-sided trading occurs, the inefficiency is considered resolved.
Rebalancing does not always mean a complete fill. Sometimes price dips only partway into the void, reacts, and continues. This partial fill still offers value because it often marks the deepest discount the market is willing to offer before resuming the trend. Other times price fills the void entirely, tags the far boundary, and only then continues. Both outcomes are normal, which is why risk management around the zone matters so much.
The direction of the original displacement usually hints at what follows. If a bullish displacement created the void, a return into it is often a buying opportunity, with the expectation that price resumes upward after rebalancing. The void becomes a discount within a larger uptrend. Understanding this ebb and flow, the push away and the pull back, is what turns theory into a usable liquidity void trading model.
Building a Liquidity Void Trading Strategy
A complete strategy layers the void with confluence rather than trading it in isolation. Start with bias. Use higher-timeframe market structure to decide whether you favor longs or shorts. If structure is bullish and you spot a bullish void below current price, you have a clean context for a long on the return.
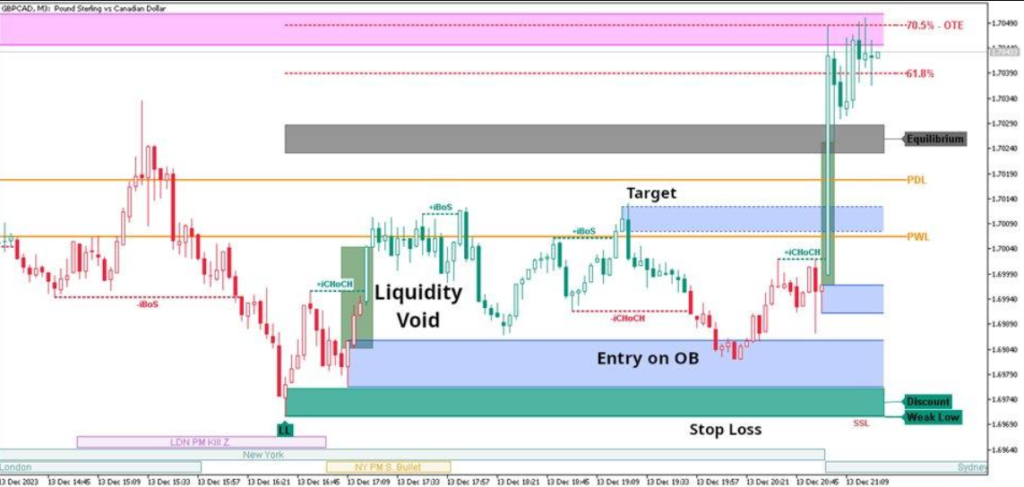
Next, refine your entry. Wait for price to trade back into the void. The most disciplined entries come at a fair value gap inside the void, at an order block that overlaps the zone, or at the void’s midpoint. Confluence between a void and an order block is especially powerful, because it stacks two independent signals at the same price. A break of structure on a lower timeframe as price enters the zone can confirm that momentum is turning your way.
Stops belong on the far side of the zone. If you buy inside a bullish void, place your stop below the void’s low, ideally beneath a nearby liquidity pool so a stop hunt does not take you out prematurely. Targets should aim at the next opposing liquidity, the origin of the displacement, or an untested high or low. This gives a defined, favorable risk-to-reward profile.
Here is the single short checklist this guide will use, kept deliberately brief:
- Confirm higher-timeframe bias, locate the void, wait for the return, enter at confluence, stop beyond the far boundary, target the next liquidity.
Patience is the quiet edge. Many voids never get retested on your timeframe, and forcing a trade where no clean confluence exists is how good concepts produce bad results. The strongest liquidity void trading decisions come from waiting for the market to hand you a high-probability return rather than chasing every gap you see.
Common Mistakes and Risk Management
The most frequent error is treating every gap as a guaranteed fill. Markets are probabilistic, not mechanical. A void raises the odds of a return; it does not promise one. Sizing a position as if the fill is certain invites large losses when the market simply trends away. Always define risk before entry and accept that some voids stay open indefinitely.
Another mistake is ignoring context. A void that forms against a strong higher-timeframe trend is far less reliable than one that aligns with it. Trading a bearish void inside a powerful uptrend often means fighting the dominant flow. Filter your setups through structure first, and let weak-context voids pass.
Overtrading lower timeframes is a third trap. Small voids fill constantly, tempting traders into a flurry of marginal entries. The cumulative spread and commission cost erodes the edge. Focus on cleaner, higher-timeframe voids where the risk-to-reward justifies the trade. Sound risk management, modest position sizing, and a willingness to sit on your hands separate durable liquidity void trading results from a string of impulsive scratches.
What Top Traders and Research Say
Serious study of voids sits within the broader discipline of price behavior and market microstructure. For a foundational grounding in reading price and momentum, John J. Murphy’s Technical Analysis of the Financial Markets remains a standard reference. It explains how sharp, one-directional moves and gaps reflect shifts in supply and demand, the same forces that create the inefficiencies void traders track.
On the academic side, Maureen O’Hara’s Market Microstructure Theory examines how orders, liquidity, and price formation interact at a granular level. Her work on how imbalances between buy and sell orders move prices provides a rigorous backbone for why single-sided delivery leaves inefficiencies that markets later resolve. It reframes the trader’s intuition about voids in the language of formal microstructure.
The psychological side deserves a nod too. Jesse Livermore captured the discipline that void trading demands with a line long attributed to him: “There is a time to go long, a time to go short and a time to go fishing.” Waiting for a void to be retested, rather than forcing action, is exactly that fishing patience in practice.
Frequently Asked Questions
What is a liquidity void in trading? A liquidity void is a zone where price moved rapidly in one direction, leaving little two-sided trading behind. This single-sided delivery creates an inefficiency the market often revisits. Understanding what is liquidity void in trading helps you anticipate where price may return to rebalance before continuing its trend.
How is an ICT liquidity void different from a fair value gap? An ict liquidity void is usually the larger region of one-sided delivery created by displacement, while a fair value gap is the smaller, precise three-candle inefficiency inside that move. The void frames your bias; the fair value gap gives you an exact level to act on. They work together rather than competing.
Does price always fill a liquidity void? No. A void raises the probability of a return, but it never guarantees one. Some voids fill completely, some fill partially, and some stay open indefinitely. This is why risk management and defined stops are essential in any liquidity void trading plan.
Which timeframe is best for liquidity void trading? It depends on your style. Scalpers use one to five minute voids, while swing traders favor four-hour and daily voids that act as stronger magnets. Higher-timeframe voids are generally more reliable but take longer to rebalance. Match the void’s timeframe to your own horizon.
How do I set a stop loss when trading a void? Place your stop beyond the far boundary of the void, ideally past a nearby liquidity pool so a stop hunt does not remove you prematurely. Combined with a target at the next opposing liquidity, this gives a defined, favorable risk-to-reward setup.
Can liquidity voids be combined with order blocks? Yes, and this is one of the strongest setups. When a void overlaps an order block, two independent signals align at the same price, increasing the odds of a clean reaction. This confluence is a cornerstone of disciplined liquidity void trading.
Final Thoughts
Liquidity voids offer a clear, logical window into how aggressive order flow shapes the chart and where price is likely to return. When you learn to spot displacement, mark the void, and wait for a confluent return, you trade with the market’s own tendency toward efficiency rather than against it. The concept is powerful precisely because it is grounded in a simple truth: markets dislike inefficiency and often move to resolve it. Pair that insight with strict risk management, higher-timeframe context, and the patience to skip weak setups, and liquidity void trading can become a dependable part of your toolkit. Keep practicing on live charts, journal every trade, and refine your reads over time. For more practical ICT breakdowns, forex strategies, and market analysis, visit forextradingboards.com and keep sharpening your edge.