
Introduction
The market maker model ICT is one of the most talked-about concepts in modern smart-money trading, and for good reason. It reframes how you see price. Instead of viewing charts as random noise, you begin to read them as engineered campaigns designed to move liquidity from retail traders to institutions. The model, popularized by the Inner Circle Trader, breaks price delivery into clear phases: accumulation, manipulation, and distribution. In this guide, we explain what is market maker model in trading, how the ict market maker buy model works against the sell model, and how price hunts stops before reversing. You will learn the core components, the timeframes that matter, the exact sequence of a campaign, and the common mistakes that trap new traders. By the end, you will read charts with far more clarity and intention.
What Is the Market Maker Model in Trading?
To understand what is market maker model in trading, start with a simple truth. Large institutions cannot buy or sell in size without moving the market against themselves. A hedge fund that wants to buy a billion dollars of a currency pair cannot simply click “buy.” Doing so would spike the price and ruin their entry. So they engineer conditions instead. They need sellers to sell into their buying, and buyers to buy from their selling. That requirement is the engine behind the entire model.
The market maker model describes the repeatable process institutions use to source that liquidity. Price is not delivered randomly. It is delivered with purpose. First, price consolidates to build orders. Next, it manipulates emotional traders by raiding obvious stop levels. Finally, it distributes toward the opposing pool of liquidity where the campaign completes. Retail traders, chasing breakouts and placing stops at obvious spots, become the fuel.
ICT frames this as a narrative you can follow. When you learn to see the phases, you stop reacting to every candle. You begin to anticipate where price must travel to fulfill its objective. This shift, from reacting to anticipating, is what makes the model so powerful for serious traders.
The Buy Model vs the Sell Model
The model has two mirror images. The ict market maker buy model engineers price lower first, then delivers it higher. The market maker sell model engineers price higher first, then delivers it lower. Both share the same DNA. Only the direction is flipped.
In a buy model, smart money wants to accumulate long positions cheaply. So price often drops into a discount zone, sweeping sell-side liquidity below prior lows. This flush traps sellers and triggers stop losses from earlier longs. Once institutions have absorbed enough orders at a discount, they reverse price sharply upward, delivering it toward buy-side liquidity resting above old highs.
The sell model works in reverse. Price rallies into a premium zone, sweeping buy-side liquidity above prior highs. Breakout buyers pile in, and short-sellers get stopped out. Then price reverses and delivers downward toward sell-side liquidity below. In both cases, the manipulation leg moves opposite to the true intended direction. That is the single most important insight in the entire framework.
The Three Phases: Accumulation, Manipulation, Distribution
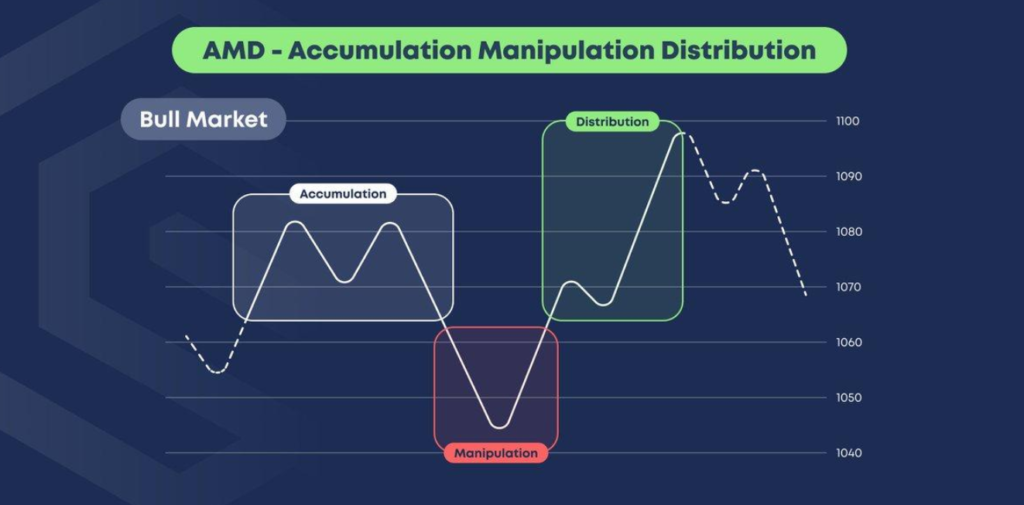
Every campaign follows the same rhythm. ICT often labels this the Power of Three, or AMD: Accumulation, Manipulation, Distribution. Understanding each phase turns a confusing chart into a readable story.
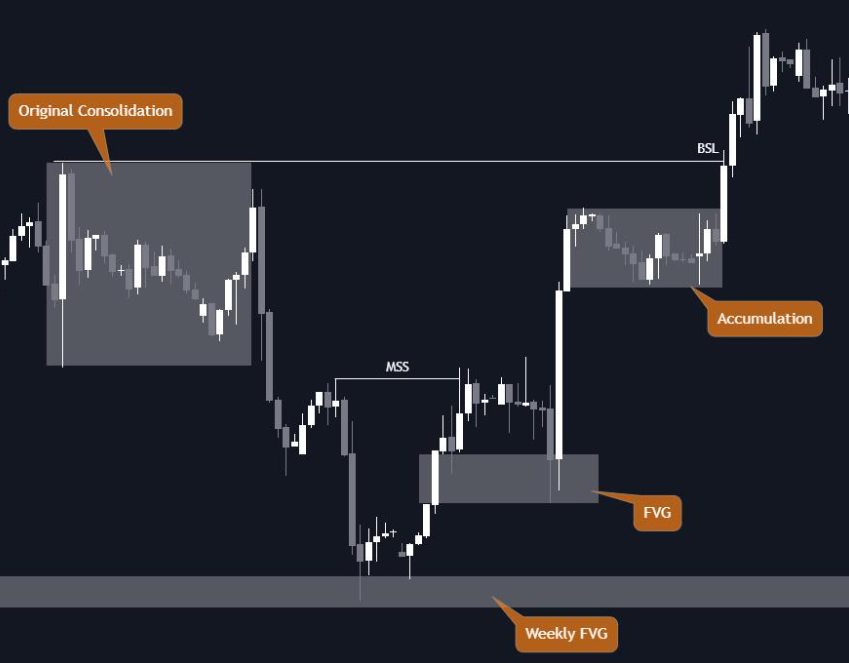
During accumulation, price consolidates in a tight range. This is the original consolidation where institutions quietly build positions. Volatility looks dull. Many traders lose interest. That boredom is intentional. It masks the order-building underneath.
During manipulation, price makes a sharp, deceptive move against the true direction. ICT calls the classic session version a Judas Swing. This is the stop raid or liquidity grab. It punishes traders who committed early and lures fresh traders into the wrong side. The manipulation leg is short-lived but violent.
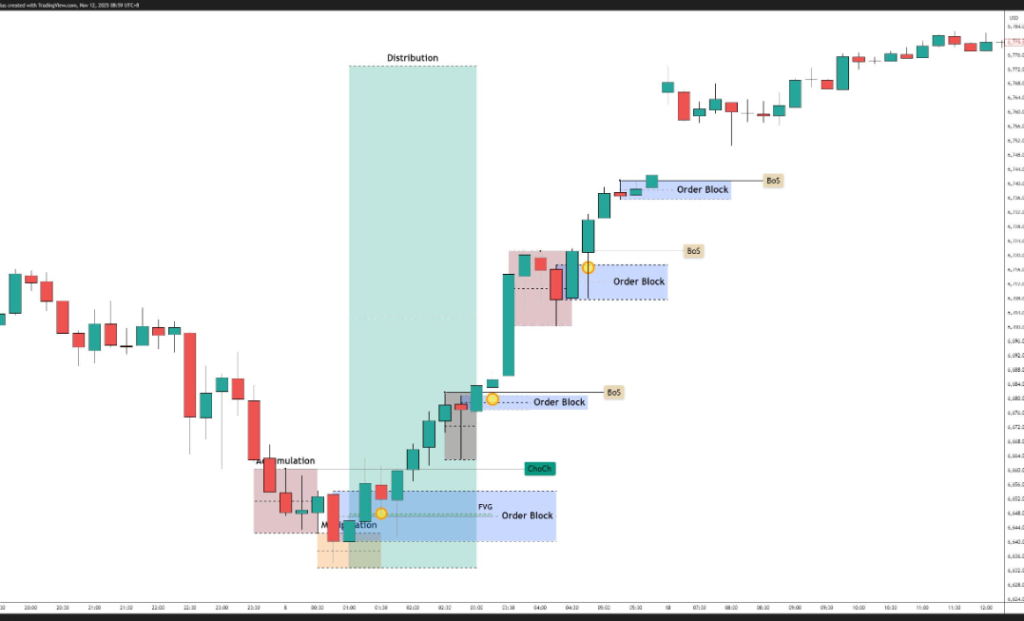
During distribution, price delivers in the true intended direction. A market structure shift confirms the reversal. Displacement, a strong impulsive move, leaves behind fair value gaps and order blocks that price often revisits before continuing. This is where the real trend unfolds and where disciplined traders align with smart money.
Here is how the phases map across both models.
| Phase | Market Maker Buy Model (MMBM) | Market Maker Sell Model (MMSM) |
|---|---|---|
| Accumulation | Consolidation builds long orders | Consolidation builds short orders |
| Manipulation | Price drops, sweeps sell-side lows | Price rises, sweeps buy-side highs |
| Smart Money Reversal | Sharp reversal upward begins | Sharp reversal downward begins |
| Market Structure Shift | Bullish MSS confirms intent | Bearish MSS confirms intent |
| Distribution | Delivery leg toward buy-side highs | Delivery leg toward sell-side lows |
| Target | Buy-side liquidity above old highs | Sell-side liquidity below old lows |
How Price Manipulates Retail Traders
The market maker model works because retail behavior is predictable. New traders place stop losses at obvious spots: just below a recent swing low or just above a recent swing high. These clusters of stops form pools of resting liquidity. Institutions know exactly where they sit.
The manipulation phase targets these pools deliberately. When price spikes below a swing low, it triggers a cascade of sell stops. Each triggered stop becomes a market sell order. That flood of selling gives institutions the cheap fills they need to build long positions. To the retail eye, it looks like a breakdown. In reality, it is a setup.
Inducement makes the trap tighter. Smart money often leaves a tempting minor high or low as bait. Retail traders enter on that bait, believing they found the move. Then price reverses, stopping them out and collecting their liquidity. The lesson is clear. The most obvious trade is often the trap. When everyone sees the same breakout, that breakout usually exists to be reversed.
Key Components: Liquidity, Order Blocks, and Fair Value Gaps
The model rests on a handful of core tools. Master these and the phases become visible on any chart.
Liquidity is the foundation. Buy-side liquidity rests above old highs where buy stops cluster. Sell-side liquidity rests below old lows where sell stops cluster. Price gravitates toward these pools because that is where orders can be filled in size.
Order blocks mark the last opposing candle before a strong displacement move. A bullish order block is the last down candle before a powerful rally. Institutions often defend these zones on a retracement, making them high-probability entry areas.
Fair value gaps, also called imbalances, are three-candle patterns where price moved so fast it left an inefficiency. The market tends to return to fill these gaps before continuing. Combined with premium and discount zones, drawn from the dealing range equilibrium, these tools form the PD arrays that ICT traders use to time entries. In a buy model, you look for entries in discount. In a sell model, you look for entries in premium.
How to Trade the Market Maker Model
Trading the model is about patience and confluence, not prediction. First, identify the current phase. Ask whether price is consolidating, manipulating, or distributing. If you cannot tell, wait. The best trades reveal themselves.
Next, mark the liquidity. Draw the highs and lows where stops likely rest. In a potential buy model, watch for a sweep of sell-side liquidity into a discount zone. That sweep is your first signal. Then wait for confirmation. A market structure shift, where price breaks a short-term high with displacement, confirms the smart money reversal is underway.
Once confirmed, look for a precise entry. The best entries sit inside a fair value gap or at an order block created during the displacement. Place your stop below the manipulation low, and target the opposing buy-side liquidity above. This gives you a tight stop and a large reward, often three to one or better. The sell model mirrors this exactly in reverse. Never chase the manipulation leg. Wait for the shift, then enter on the retracement into a discount or premium array.
Timeframes and How to Structure Your Analysis
The model is fractal. It appears on the monthly chart and on the one-minute chart alike. The skill lies in aligning timeframes so you trade with the bigger flow rather than against it.
Start with a higher timeframe, such as the daily or four-hour, to establish bias and locate major liquidity pools. This tells you whether you should be hunting a buy model or a sell model. Then drop to a lower timeframe, such as the fifteen or five minute, to time your entry during the manipulation and distribution phases. ICT ties many setups to specific killzones, the high-volatility windows around the London and New York opens, when manipulation moves are most likely to fire.
The rule is simple. Higher timeframes tell you where. Lower timeframes tell you when. When both agree, your probability rises. When they conflict, stand aside. Forcing a trade against the higher timeframe narrative is one of the fastest ways to get caught in a stop raid yourself.
Common Mistakes Traders Make
Even a powerful model fails in undisciplined hands. The most frequent error is entering during the manipulation phase, mistaking the stop raid for a genuine breakout. Wait for the market structure shift. Do not front-run it.
A second mistake is ignoring the higher timeframe. Traders spot a clean buy model on the five minute while the daily is clearly delivering a sell model. The lower timeframe setup gets steamrolled. Always anchor your bias to the higher timeframe.
Other frequent errors deserve a quick checklist:
- Chasing price after displacement instead of waiting for the retracement into an order block or fair value gap
- Placing stops at obvious swing points, the exact spots smart money targets
- Overcomplicating the chart with dozens of indicators instead of reading pure price and liquidity
- Trading outside the killzones during low-volatility, low-conviction sessions
Finally, many traders abandon the model after a few losses. No model wins every time. The edge comes from repeating high-probability setups with strict risk control over hundreds of trades, not from any single perfect entry.
What Top Traders and Research Say
The market maker model draws on ideas that predate ICT and appear across serious market literature. In Market Microstructure Theory, Maureen O’Hara examines how dealers and informed traders interact, and how price formation depends on the flow of orders and information. Her work grounds the intuition behind the model: price is a mechanism for sourcing liquidity, not a neutral scoreboard.
Academic research reinforces this. The classic study by Lawrence Glosten and Paul Milgrom (1985), “Bid, Ask and Transaction Prices in a Specialist Market with Heterogeneously Informed Traders,” shows how market makers adjust prices to protect themselves against informed order flow. The paper formalizes why spreads exist and how dealers manage adverse selection, echoing the manipulation-and-delivery logic traders observe on charts.
On the psychology side, Mark Douglas captured the trader’s real challenge in Trading in the Zone. As he put it, “Anything can happen.” That short reminder underlines why the model is a probability framework, not a certainty. Institutions engineer conditions, but no single trade is guaranteed. Combine the microstructure insight with disciplined risk management, and the model becomes a durable edge rather than a magic formula.
Frequently Asked Questions
What is the market maker model in ICT? The market maker model ICT is a framework describing how institutions engineer price to source liquidity. It splits price delivery into accumulation, manipulation, and distribution. Price consolidates, raids obvious stop levels, then delivers in the true direction toward the opposing liquidity pool. It helps traders anticipate moves rather than react to them.
How does the market maker buy model work? The ict market maker buy model first drives price lower into a discount zone, sweeping sell-side liquidity below prior lows. This traps sellers and gives institutions cheap long fills. After a market structure shift confirms the reversal, price delivers upward toward buy-side liquidity above old highs, completing the campaign.
What is the difference between the buy model and sell model? Both models share the same three phases but move in opposite directions. The buy model manipulates price down before delivering up. The sell model manipulates price up before delivering down. Understanding what is market maker model in trading means recognizing that the manipulation leg always runs counter to the true intended direction.
Which timeframes work best for the market maker model? The model is fractal and works on all timeframes. Use higher timeframes, like daily or four-hour, to set bias and locate liquidity. Use lower timeframes, like fifteen or five minute, to time entries during manipulation and distribution, ideally within the London or New York killzones.
Is the market maker model the same as Wyckoff? They share strong similarities. Wyckoff’s accumulation and distribution schematics closely mirror the model’s phases. ICT adds specific tools such as fair value gaps, order blocks, and premium and discount arrays, plus a session-based approach to timing. Think of them as complementary frameworks describing similar institutional behavior.
Final Thoughts
The market maker model ICT rewards traders who trade patiently and think in phases. Once you see accumulation, manipulation, and distribution, the chart stops feeling random. You learn to wait for the stop raid, confirm the market structure shift, and enter with the true direction toward the opposing liquidity. Combine that structure with strict risk control and higher-timeframe alignment, and you hold a genuine, repeatable edge. Do not rush it. Study clean examples, backtest your setups, and let confluence build before you commit. For more in-depth guides on smart money concepts, liquidity, and institutional order flow, keep learning with us at forextradingboards.com, your resource for practical, professional forex education.
Related guides: