
Introduction
Reading raw candles is the oldest edge in the market, and these price action trading tips for forex will help you trade what the chart actually shows instead of what an indicator suggests after the fact. Price action strips the screen down to bare candles, support, resistance, and structure, so you react to real buying and selling pressure in real time. This guide walks you through the core skills that separate consistent traders from chart watchers. You will learn how to mark levels that matter, how to read candlestick signals in context, and how to build repeatable entries with tight risk. We cover the best price action tips for forex, the highest-probability forex price action setups, and the psychology that holds it all together. By the end, you will have a clear framework you can apply to any pair, on any timeframe, starting on your very next chart.
Why Price Action Beats Indicator Overload
Most new traders bury their charts under a dozen indicators and wonder why their decisions feel slow and uncertain. Indicators are mathematical transformations of price, which means they always lag the very thing you are trying to read. By the time a moving average crossover prints or an oscillator flashes oversold, price has already moved. Price action trading removes that delay by putting you face to face with the raw data: every candle is a record of the battle between buyers and sellers over a fixed period.
When you trade naked charts, you train your eye to see what the market is doing rather than what a formula calculated three bars ago. You start noticing where price stalls, where it accelerates, and where large players defend a level. This sensitivity is impossible to automate fully, and it is exactly what gives discretionary traders an edge that survives across changing market conditions.
That does not mean indicators are useless. A single moving average can help define trend direction, and volume tools add context in some markets. The point is hierarchy. Price comes first, and everything else is secondary confirmation. When you flip that order and let an indicator override what the candles clearly show, you trade against the market instead of with it. Keep your screen clean, keep price at the center, and let the chart speak before any tool gets a vote.
Mark the Levels That Actually Matter
Support and resistance form the skeleton of every price action chart, yet most traders draw far too many lines and clutter their view. The goal is not to mark every minor swing but to identify the handful of levels where price has clearly reacted more than once. A level earns respect when buyers or sellers have defended it repeatedly, leaving long wicks, sharp reversals, or strong breakouts in its wake.
Start on the higher timeframes. Open the daily and four-hour charts first, mark the obvious turning points, then drop to your trading timeframe. Levels drawn from higher timeframes carry more weight because more participants see them and act on them. A daily resistance zone will influence price far more reliably than a five-minute pivot that only scalpers notice. This top-down habit keeps you anchored to the structure that institutional flow actually respects.
Think in zones, not exact prices. The market rarely turns at a single pip, so treat each level as a band a few pips wide. Round numbers and psychological prices, such as 1.1000 or 150.00 on USD/JPY, often act as magnets and reversal points because so many orders cluster there. When a key level lines up with a round number and a higher-timeframe swing, you have genuine confluence, and these are the spots where the best price action tips for forex earn their keep. Patience at clean levels beats activity at random ones every time.

Read Candlesticks in Context, Not Isolation
A candlestick pattern means nothing until you know where it forms. A bullish pin bar in the middle of nowhere is noise; the same pin bar rejecting a major support level after an extended downtrend is a signal worth acting on. Context is the multiplier that turns a common shape into a high-probability event. Always ask three questions before trusting a candle: What is the trend? Where on the chart is this happening? And what just preceded this bar?
The most reliable single-bar signals are the pin bar and the engulfing candle. A pin bar has a small body and a long wick that pierces a level then snaps back, showing that one side tried to push through and failed. An engulfing candle fully swallows the prior candle’s range, signaling a sudden shift in control. Both work best at the edges of structure, where they confirm that a level is holding and momentum is turning.
Multi-bar patterns add another layer. The inside bar, where one candle sits entirely within the range of the previous one, signals a pause and a coiling of energy that often precedes a breakout. When an inside bar forms after a strong trend move at a level, it offers a tight, low-risk entry with a clearly defined stop. Doji candles flag indecision and warn you that momentum may be stalling. None of these shapes are magic, but read inside the right context they become some of the most dependable forex price action setups available to a discretionary trader.

High-Probability Forex Price Action Setups
Once you can read levels and candles, you assemble them into repeatable setups. The first and most forgiving is the trend pullback. In an established uptrend marked by higher highs and higher lows, you wait for price to retrace to a prior support level or a moving average, then enter on a bullish rejection candle. You trade with the dominant flow, your stop sits just below the level, and your target is the next swing high. This setup keeps you on the right side of momentum while buying a temporary discount.
The second core setup is the level rejection, sometimes called the false break or stop hunt. Price pushes beyond a well-defined support or resistance, triggers stops, then reverses hard back inside the range. That failed breakout traps late traders and fuels a powerful move in the opposite direction. The signal is a sharp wick through the level followed by a close back inside it. These reversals offer excellent risk-to-reward because your stop sits just past the wick while your target spans the full range.
The third setup is the breakout and retest. Price breaks cleanly through a level on strong momentum, then returns to test that level as new support or resistance before continuing. Entering on the retest rather than the initial break filters out many fakeouts and gives you a tighter stop. Below is a quick comparison of these three workhorse setups so you can see how they differ in market condition, trigger, and ideal placement.
| Setup | Best Market | Entry Trigger | Stop Placement | Typical R:R |
|---|---|---|---|---|
| Trend Pullback | Trending | Rejection candle at support in uptrend | Below the level | 1:2 to 1:3 |
| Level Rejection | Ranging or reversal | Failed break, close back inside | Beyond the wick | 1:3 or better |
| Breakout Retest | Trending after range | Bounce off broken level | Behind the retest | 1:2 to 1:4 |
Each setup has a clear story behind it, and that story is what you are really trading. Memorizing shapes is not enough; you must understand the order flow each pattern implies. When you know why a setup works, you can spot it forming early and skip the low-quality versions that only look right on the surface.
Build a Confluence Checklist Before You Enter
The difference between a good trade and a gamble is confluence: several independent factors pointing the same direction at the same spot. A pin bar alone is a maybe. A pin bar at a daily resistance level, aligned with a round number, against an overextended move, forming in the direction of the higher-timeframe trend, becomes a high-conviction trade. Stacking reasons filters out the marginal entries that drain accounts over time.
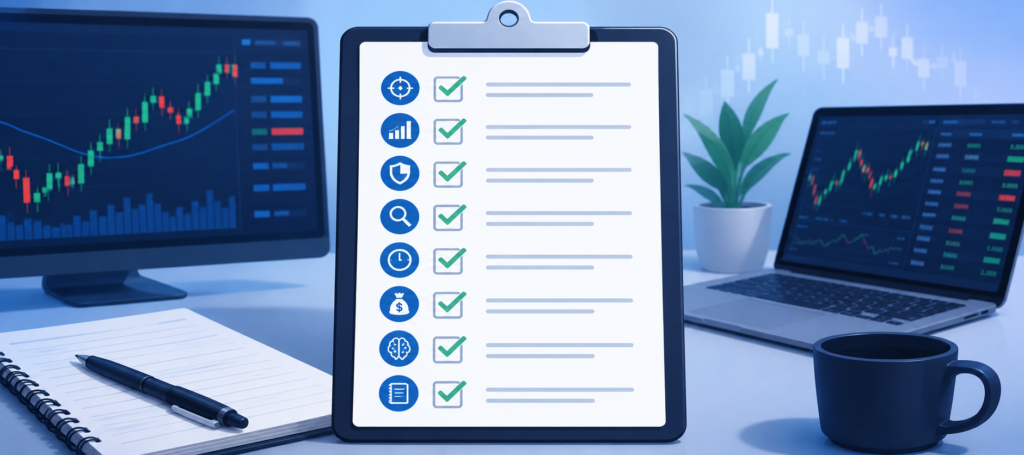
Build a short mental checklist and run every potential trade through it. Does the setup align with the higher-timeframe trend or a clear reversal level? Is there a recognized candlestick signal confirming the turn? Does the level coincide with a round number, a prior swing, or a supply and demand zone? Is the risk-to-reward at least two to one after placing a sensible stop? If a trade ticks three or more boxes, it deserves your capital. If it ticks one, let it go without regret.
This discipline protects you from the most common failure in price action: seeing patterns everywhere. The human brain is wired to find shapes in randomness, and charts are full of noise that looks meaningful. A confluence requirement forces objectivity. It also keeps your trade frequency low, which is a feature, not a bug. Fewer, better trades compound into a smoother equity curve and a calmer mind, both of which are essential for staying in the game long enough to win.

Risk Management: The Real Edge
You can read every candle perfectly and still blow up an account without sound risk management. The hard truth is that your edge lives in the math of position sizing and stop placement, not in any single setup. Professional traders risk a small, fixed percentage of their account on each trade, often one percent or less. That way, a string of losses, which is inevitable, never threatens their survival. Survival is the whole point, because you cannot profit from a strategy you have already been knocked out of.
Place your stop where the trade idea is proven wrong, not where it feels comfortable. If you enter on a pin bar rejecting support, your stop belongs just below the wick. If price closes there, your premise has failed and you want to be out. Then size your position so that the distance to that stop equals your fixed risk amount. This reverses the amateur habit of choosing a lot size first and squeezing a stop to fit. Let the chart dictate the stop, and let the stop dictate the size.
Targets matter just as much. Aim for setups that offer at least two units of reward for every unit of risk, and let your winners run toward the next major level rather than grabbing tiny profits out of fear. A trader who wins only forty percent of the time still grows an account steadily at a two-to-one reward ratio. That is the quiet power of asymmetry. When you combine clean forex price action setups with strict risk control, you stop chasing a high win rate and start building a durable, positive expectancy.
Practice the Psychology Behind the Patterns
Price action exposes you because there is no indicator to blame. Every decision is yours, and that makes the mental game decisive. The same setup that you trade flawlessly in a demo account can fall apart with real money on the line, because fear and greed distort judgment. Recognizing this gap early, and respecting it, is one of the best price action tips for forex that rarely appears on a chart.
Discipline starts with a written plan. Define your setups, your risk per trade, and your daily limits before the session, then follow them mechanically. When you feel the urge to enter outside your rules, that urge is data: it usually means boredom or revenge rather than a real signal. Keeping a trading journal with screenshots of every entry and your reasoning at the time turns vague feelings into measurable patterns you can fix.
Detachment from any single trade is the goal. Think in probabilities, not certainties, and accept that losses are simply the cost of doing business. A losing trade that followed your rules is a good trade; a winning trade that broke your rules is a dangerous one. Hold that distinction firmly and the emotional swings that wreck most accounts begin to flatten. The market rewards the calm and patient far more reliably than the clever and quick.
Backtest, Forward Test, Then Scale Slowly
A strategy you have not tested is just a hope. Before risking real capital, you should backtest your chosen setups across hundreds of historical examples to understand how they behave in trends, ranges, and choppy conditions. Scroll back on the charts, mark where your setup appeared, and record the outcome honestly, including the trades you would have skipped. This builds the pattern recognition that lets you act decisively when a clean signal forms live.
Forward testing on a demo account comes next, but keep it short and purposeful. A demo removes the emotional weight of real money, so treat results as a check on your mechanics, not proof of profitability. Once your execution is consistent, move to a small live account where the stakes are real but survivable. Trading tiny size with real emotions teaches lessons no simulator can, and it does so cheaply.
Scaling up should be slow and earned. Increase your risk only after you have proven consistency over a meaningful sample of trades, not a lucky week. Many promising traders destroy themselves by sizing up after a hot streak, mistaking variance for skill. Let your results, recorded objectively in your journal, dictate the pace. Steady, disciplined growth keeps you in the market for years, and the market only pays those who stay.
What Top Traders and Research Say
Serious students of the chart return to the same foundational works again and again. Al Brooks, in Reading Price Charts Bar by Bar, makes the case that every individual candle carries actionable information when read in the context of the bars around it, a philosophy at the heart of pure price action trading. For the origins of candlestick analysis, Steve Nison’s Japanese Candlestick Charting Techniques remains the definitive reference that introduced these patterns to Western traders. And on the mental side, Mark Douglas’s Trading in the Zone argues persuasively that consistent results come from a probabilistic mindset rather than from predicting any single outcome.
Academic research lends measured support to chart reading. The well-known study by Lo, Mamaysky, and Wang, “Foundations of Technical Analysis” (2000), used pattern-recognition algorithms across decades of data and concluded that several technical patterns do carry incremental information value. The work stopped short of guaranteeing profits, but it pushed back on the idea that chart patterns are pure superstition. Separately, the research of Barber and Odean on individual investors highlights how overtrading erodes returns, a sobering reminder of why patience and selectivity matter so much in price action.
The legends say it most simply. As Jesse Livermore observed, “The big money is not in the buying and selling, but in the waiting.” That single line captures the discipline this guide has built toward. Read alongside the structured frameworks of Brooks, Nison, and Douglas, it reinforces a clear message: master the levels, respect the risk, and let high-quality setups come to you.
Frequently Asked Questions
What are the best price action trading tips for forex beginners? Start by trading naked charts on the daily and four-hour timeframes, where signals are cleaner and noise is lower. Mark only the major support and resistance levels and wait for a clear rejection candle before entering. Risk a small fixed percentage per trade and always set a stop where your idea is proven wrong. Above all, focus on a few high-quality setups rather than trading every candle that looks interesting.
Can you trade forex profitably using only price action? Yes, many discretionary traders rely entirely on raw price without indicators. Price action gives you a real-time read on supply and demand, which is what ultimately moves any pair. The key is pairing clean forex price action setups with strict risk management and patience. Profitability comes from positive expectancy over many trades, not from winning every single one.
Which candlestick patterns work best for forex price action? The pin bar, the bullish and bearish engulfing candle, and the inside bar are among the most reliable. Their value depends heavily on context, so they work best when forming at significant support or resistance in line with the trend. A pattern at a key level carries far more weight than the same shape in the middle of a range. Always read the candle inside the structure surrounding it.
How important is risk management in price action trading? It is the single most important factor in long-term survival. Even a strong reading edge cannot save an account that risks too much per trade. Keep risk small, place stops at logical invalidation points, and target at least two units of reward per unit of risk. Sound money management turns a good strategy into a durable one.
How long does it take to learn price action trading? Most traders need several months of consistent study, backtesting, and demo practice before their execution stabilizes. The chart-reading skill builds gradually through repetition, so reviewing hundreds of historical setups accelerates the process. Real progress shows up as steadier decisions and a calmer mindset, not just bigger profits. Patience with your own learning curve is part of the discipline.
Final Thoughts
Price action rewards the trader who keeps it simple, stays patient, and respects risk above all else. The framework in this guide moves from clean levels to candle reading, from repeatable setups to confluence filtering, and finally to the risk control and psychology that hold everything together. None of it requires exotic tools, only a disciplined eye and the willingness to wait for quality. Treat each of these price action trading tips for forex as a skill to practice rather than a shortcut to chase, and your decisions will sharpen with every chart you review. Build your checklist, journal your trades, and scale only when your results have earned it. For more practical guides, setup breakdowns, and market analysis to sharpen your edge, visit forextradingboards.com and keep building your trading skills.
This article is for educational purposes only and is not financial advice. Trade at your own risk.