
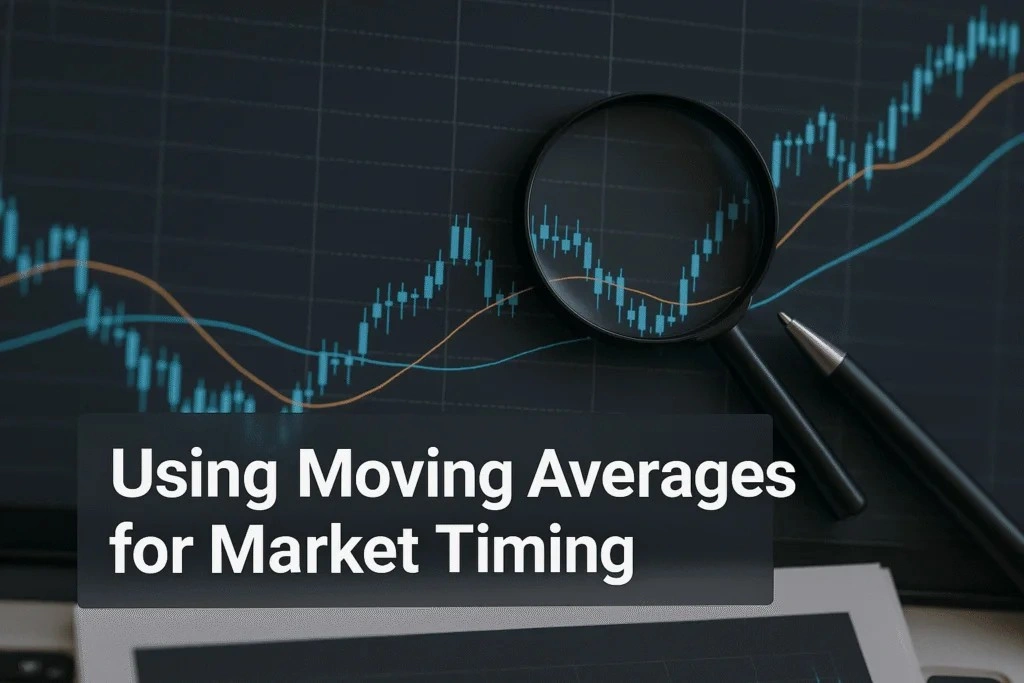
Introduction:
Timing is everything in trading. Entering too early or exiting too late can make the difference between profit and loss. One of the simplest and most effective methods to time trades is moving average trading.
Moving averages are popular trend indicators used to smooth out price data and reveal the market’s true direction. When applied correctly, they help traders identify optimal entry and exit points.
This guide explains how to use moving averages to time the market with precision, covering both single and crossover strategy approaches without unnecessary complexity.
What Is a Moving Average in Trading?
A moving average (MA) is a line that shows the average price of an asset over a set number of periods. It updates as each new period closes, making the line “move.”
Traders use MAs to reduce price noise and highlight the dominant trend. Instead of reacting to every fluctuation, the moving average offers a smoother view of direction and potential reversals.
Types of Moving Averages
There are two main types used in moving average trading:
- Simple Moving Average (SMA):
Calculates the average price over a defined period (e.g., 20, 50, or 200 days).
Example: The 50-day SMA adds the last 50 closing prices and divides them by 50.
- Exponential Moving Average (EMA):
Gives more weight to recent prices, making it more responsive to new information.
Traders often prefer the EMA for shorter time frames or volatile markets.
Why Moving Averages Matter for Market Timing
The main goal of technical analysis is to find the trend and follow it. Moving averages make this process simpler by providing visual guidance on direction and momentum.
Here’s why they are essential:
- Clarify Trend Direction:
An upward-sloping MA signals a bullish trend, while a downward slope indicates bearishness.
- Act as Dynamic Support or Resistance:
Price often bounces off popular MAs like the 50-day or 200-day.
- Generate Entry and Exit Signals:
Crossover points or price interactions with the MA highlight potential trade opportunities.
This approach aligns with the core ideas discussed in our Comprehensive Guide to Forex Technical Analysis, where price action, chart analysis, and trend trading form the foundation of professional decision-making.
How to Use Moving Averages for Trade Entries
Identifying entries using moving averages involves observing the relationship between price and the MA line.
1. Price Above or Below the MA
- When price crosses above a key moving average, it signals potential upward momentum.
- When the price crosses below, it may indicate a bearish shift.
2. The Crossover Strategy
The crossover strategy is one of the most widely used techniques in moving average trading. It involves using two different MAs, one short-term and one long-term.
How It Works:
- Bullish Crossover (Golden Cross):
Occurs when a short-term MA (e.g., 50 EMA) crosses above a long-term MA (e.g., 200 EMA).
Suggests trend reversal to the upside and possible entry.
- Bearish Crossover (Death Cross):
Occurs when the short-term MA crosses below the long-term MA.
Indicates downward pressure and potential selling opportunities.
Why It Works:
The crossover strategy reflects a shift in momentum. When the short-term line moves faster and overtakes the slower line, it means buyers or sellers are gaining control.
How to Use Moving Averages for Trade Exits
Exiting trades effectively is as important as entering them. Moving averages help here, too.
1. Price Crossing Back Over the MA
If you entered a long trade when the price broke above the MA, an exit signal might occur when the price drops back below it.
This ensures profits are protected when trends weaken.
2. Opposite Crossover Signal
In a crossover strategy, the opposite cross often acts as an exit trigger.
For example:
- If you entered on a Golden Cross, exit on a Death Cross.
- If you entered on a Death Cross, exit on a Golden Cross reversal.
3. Trailing Stop with Moving Average
Some traders trail their stop-loss orders below the moving average (for long positions) or above it (for short positions).
This method locks in profits while allowing trends to continue.
Combining Moving Averages with Trend Indicators
While moving averages are powerful on their own, combining them with other trend indicators adds extra confirmation.
Here are some common pairings:
- MACD (Moving Average Convergence Divergence):
Measures the difference between EMAs and confirms momentum strength.
- ADX (Average Directional Index):
Helps determine trend strength. A strong ADX reading supports MA signals.
- Price Action:
Candlestick formations near moving averages often reinforce signal validity.
Common Mistakes When Using Moving Averages
Even experienced analysts sometimes misuse moving averages. Avoid these common pitfalls:
- Using Too Many MAs:
Multiple overlapping lines clutter the chart and create confusion. Stick to one or two key settings.
- Ignoring Market Context:
MAs work best in trending markets. In sideways ranges, signals often fail.
- Chasing Every Crossover:
Wait for confirmation, such as a candle closing beyond the MA or trend strength indicators.
- Neglecting Risk Management:
Always use stop-loss orders. No technical signal guarantees success.
Practical Example: Moving Average in Action
Let’s consider an example using GBP/USD on a 4-hour chart.
- The 50 EMA is sloping upward ; the trend is bullish.
- Price retraces and touches the 50 EMA, forming a bullish engulfing candle.
- The short-term 20 EMA crosses above the 50 EMA, confirming entry.
- A logical stop-loss sits below the last swing low.
- Exit when price closes below the 50 EMA or when the 20 EMA crosses back down.
Advantages of Moving Average Trading
- Simple and Visual, Easy to understand and apply across markets.
- Effective in Trends Captures momentum efficiently.
- Adaptable Works on all time frames and instruments.
- Objective: Reduce emotional decision-making.
How Moving Averages Fit into Forex Technical Analysis
Moving averages are just one part of broader forex technical analysis. They interact with tools like chart analysis, price action, and trend trading to form a complete market strategy.
For a deeper understanding of how these components connect, read the Comprehensive Guide to Forex Technical Analysis. It explains how traders integrate multiple methods to form reliable trading systems.
Developing a Moving Average Trading Plan
Consistency comes from structure. A clear plan helps apply moving averages systematically.
Sample Plan Outline
- Identify Trend: Use long-term MA slope to define direction.
- Find Entry Look for crossover or price interaction with MA.
- Confirm Trend Strength: Use ADX or price action clues.
- Set Stop-Loss Place beyond the recent swing high or low.
- Define Exit: Use opposite crossover or trailing MA stop.
- Review the Log trade data for performance tracking.
Conclusion: Timing the Market with Moving Averages
Moving average trading remains one of the simplest yet most reliable methods for identifying trends, entries, and exits.
By mastering the crossover strategy and understanding trend indicators, technical analysts can trade with structure and clarity.
Moving averages remove noise and reveal what truly matters: direction and momentum. Whether you trade short-term or long-term, their consistent logic provides confidence in every decision.
For further educational resources, explore our Technical Analysis Category to continue building your trading knowledge and skills.
Advanced Moving Average Strategies for Entry Timing
Beyond the basic crossover signals, experienced traders use moving averages to time entries with greater precision by combining them with price action context. The “moving average retest” is one of the most reliable setups: wait for price to cross above a rising 50 EMA, pull back to retest the EMA as support, and then enter long on the first bullish candlestick confirmation at that level. This approach filters out the false signals that plague simple crossover systems and gives you a defined invalidation point — if price closes below the EMA after your entry, the setup has failed.
The “moving average stack” technique uses three or more moving averages arranged in bullish order (short-term above mid-term above long-term) to confirm the strength of a trend before entering. On a 4-hour chart, a setup where the 20 EMA is above the 50 EMA, which sits above the 200 EMA, with price trading above all three, signals a strong uptrend where long entries carry statistical advantages. Entering on pullbacks to the 20 EMA within this configuration puts the trend momentum firmly behind your trade.
Dynamic support and resistance with moving averages is particularly effective on higher timeframes (daily and weekly charts). The 200-day moving average is one of the most widely watched technical levels in all financial markets. When EUR/USD, for example, tests its 200-day MA after a significant downtrend, the resulting bounce attempts are often highly traded by institutions and generate strong, clean setups for technically-oriented retail traders. Levels watched by large participants tend to become self-fulfilling, making them more reliable than obscure indicators.
Common Moving Average Mistakes That Lead to Poor Timing
The most frequent error traders make with moving averages is treating crossovers as mechanical buy or sell signals without considering the broader market context. In a choppy, sideways market, moving average crossovers produce a continuous stream of false signals that generate net losses even when executed perfectly. Always check whether the market is trending or range-bound before applying a moving average strategy. The Average Directional Index (ADX) can help — readings above 25 suggest a trending environment where moving averages work well; below 20 indicates a range where they do not.
Another common mistake is using too many moving averages simultaneously, which creates conflicting signals and analysis paralysis. Choose one or two moving averages that match your trading timeframe and strategy, learn their behaviour thoroughly across different market conditions, and use them consistently. Changing your moving average settings every time you see a setup that did not work well is a form of overfitting — you are optimising for the past rather than building a robust approach for the future.
Frequently Asked Questions: Moving Averages for Market Timing
What is the most reliable moving average for forex trading?
There is no universally “best” moving average — effectiveness depends on your trading timeframe and strategy. The 50 EMA and 200 EMA are widely used on daily charts for trend identification and dynamic support/resistance. The 20 EMA is popular on 4-hour charts for momentum trading. The key is consistency: choose settings that fit your approach and stick with them long enough to evaluate performance objectively across a range of market conditions.
What is the difference between a simple moving average (SMA) and exponential moving average (EMA)?
A simple moving average gives equal weight to all price data points in the period. An exponential moving average gives more weight to recent prices, making it more responsive to current market conditions. EMAs react faster to price changes, which makes them better suited to short-term trading and trend-following strategies. SMAs are smoother and more resistant to minor price fluctuations, which makes them useful for identifying long-term support and resistance levels. Most short-term forex traders prefer EMAs for this reason.
Should I use moving averages on every timeframe?
Yes, but look for confluence between timeframes for the highest-probability setups. If price is bouncing off the 200 EMA on the daily chart and simultaneously testing the 50 EMA on the 4-hour chart at the same price level, that alignment of two timeframes creates a much stronger technical setup than either signal would produce alone. Multi-timeframe confluence is one of the most underused techniques for improving the accuracy of moving average-based strategies.
How do moving averages perform in forex versus stocks?
Moving averages work similarly across asset classes, but forex markets have some specific characteristics worth noting. Major currency pairs like EUR/USD and GBP/USD are highly liquid and trend cleanly on higher timeframes, making moving averages particularly effective. Pairs with lower liquidity or those dominated by central bank intervention (such as JPY pairs around BOJ policy events) can produce false signals more frequently. Always consider the fundamental backdrop of the currency pair you are trading when assessing whether a moving average signal has merit.
Can moving averages be used for trade exits as well as entries?
Absolutely. Trailing a stop below a rising moving average — for example, keeping your stop 10–15 pips below the 20 EMA on the timeframe you traded — allows you to stay in trending moves for extended periods without setting arbitrary profit targets. As the price trends higher and the EMA rises with it, your trailing stop rises too, locking in profits while still giving the trade room to run. This approach captures the full extent of strong trend moves, which is where the majority of trading profits are generated.